Category Archives: Blogs

Recent and past blog posts by Dr. Carey W. King.

3 ways Texas can make its electric grid more resilient once power outages end

OPINION: 3 ways Texas can make its electric grid more resilient once power outages end 

MarketWatch, February 17, 2021

In the face of ERCOT’s rolling blackouts during the 2021 Valentine’s Day winter storm Uri, resist blaming one power source because that detracts from making the entire electricity and energy system reliable.  Read more …

Explanation of the Jevons Paradox (or “backfire” effect) using the HARMONEY model

December 6, 2020

In this blog I use my HARMONEY (“Human And Resources with MONEY”) economic growth model (also see this free early version) to demonstrate the dynamics of the Jevons Paradox: that an increase in end-use efficiency leads to an increase in total resource extraction, rate of resource depletion, and final level of depletion.

Here I summarize some important features and assumptions of the HARMONEY model to give context for why it exhibits the behavior summarized below:

  • Natural resources: There is only one natural resource, and it is modeled as something akin to a forest where the resource can grow back (at some rate) after it is depleted. By this assumption, the economy can also continuously extract resources at the same rate the resources are regenerated as sort of a steady state economy.
    • As resources are depleted, it takes more resources to extract the next unit of resources. This presents the ability to check the feedbacks of going after harder-to-reach resources after accessing the easiest resource first.  It also allows me to calculate net energy return ratios, the so-called “energy return on energy invested” but what I will call (in later figures) the “net external power ratio”.
  • Population: Population is endogenous such that population growth and decline is dependent on the level of per capita resources consumption. If there are not enough natural resources left for households to consume (per person), then population can decline and level off.
  • There are 2 industrial sectors:
    • The “goods” sector uses labor and capital (e.g., machines) to make new capital.
    • The “extraction” sector uses labor and capital to extract resources.
  • Capital requires resources consumption for
    • Its operation (e.g., it needs fuel to operate)
    • Its creation (e.g., capital is made out of natural resources)
  • Prices: I keep the assumption from the main results in my HARMONEY paper (King (2020)) which is that prices are calculated by assuming a constant markup on the full cost of producing outputs (full cost includes wages, intermediate costs, depreciation, and interest payments).

Here I’ll focus on changing the parameter that affects how many resources are required for consumption to operate capital to produce a unit of its output.  Equation (1) describes the quantity of natural resource consumption required during the operation of capital where K is the amount of physical capital, CU is the capacity utilization (a number between 0 and 1 indicating the fraction of the time the capital operates), and η is like an efficiency term, but its units are different.  The symbol η represents “resources consumed per unit of capital” and its units are [resources/(time·capital)].


natural resource consumption to operate capital = η·K·CU     (1)


Equation (1) holds for both goods sector operation (e.g., fuel to operate machines that make more machines) and extraction sector operation.


Demonstrating Jevons Paradox (or the backfire effect)

I will show a series of outputs from the HARMONEY model. There are two simulation results shown on each figure. The solid line represents the simulation where each η remains at a constant value of 0.16 throughout the simulation.  The dashed line represents the simulation where each η decreases, starting at year = 50, from its maximum value of 0.16 to a minimum value of 0.0533 as a function of how fast new capital is created (e.g., rate of investment).  Importantly, a decreasing η represents the SAME effect as increasing thermodynamic efficiency of an electric motor, steam turbine, combustion engine, etc.   Figure 1 shows the constant η for the first simulation and the decreasing η for the second simulation.

Figure 1. The amount of resources consumption, or η, to operate a unit of capital in (left) the extraction sector and (right) the goods sector.  Solid line = constant η (constant efficiency).  Dashed line = decreasing η (increasing efficiency).


Figure 2 shows the amount of resources that resides in the environment, yet to be extracted.  In the constant efficiency scenario, the resource can get extracted to a level of near 65 units of resources remaining (65% of its maximum possible level) at its most depleted state.  In the increasing efficiency case, the resource is depleted to near half of its maximum level at about 50 units of resources remaining at its most depleted state.


Figure 2. The amount of natural resources available, or remaining, in the environment for the economy and population to consume decreases when machines become more efficient.  Solid line = constant η (constant efficiency).  Dashed line = decreasing η (increasing efficiency).


Figure 3 shows the resources extraction rate that increases for the dashed line increasing efficiency scenario.   (NOTE: By the definition of the resource as a forest, the maximum resource extraction rate occurs when the resource is depleted to half of its maximum level. I have chosen the parameters to not extract (much) past the 50% level for the purposes of this blog as this most accurately represents our primary use of fossil fuels.)

 
Figure 3. The rate of resource extraction increases when machines become more efficient.  Solid line = constant η (constant efficiency).  Dashed line = decreasing η (increasing efficiency).


Figure 4 shows a higher human population for the scenario in which there is increased machine efficiency.  If a model assumes a constant or exogenous population growth, then it probably cannot exhibit the backfire effect (or Jevons Paradox).  The reason that population increases with higher efficiency is that after resources are consumed to (i) operate machines and (ii) make more machines, the higher efficiency allows for more resources to be left for human consumption such that death rates remain low for a longer period of time that in turn allows population to increase for a longer period of time.  Eventually, population levels off even in the increased efficiency scenario, but in a world also with more machines (more capital).

 
Figure 4. The human population increases when machines become more efficient.  Solid line = constant η (constant efficiency).  Dashed line = decreasing η (increasing efficiency).


Figure 5 shows the amount of total capital that is higher for the scenario in which there is increased machine efficiency.  The reason that the capital stock increases with higher efficiency is that after resources are consumed to operate machines, the higher efficiency allows for more resources to be left for the creation of more machines.

 
Figure 5. The total capital in the economy (both for the extraction and goods sectors) increases when capital operates with higher resources efficiency.   Solid line = constant η (constant efficiency).  Dashed line = decreasing η (increasing efficiency).


With increased capital, population, and resources extraction (the of the major “factor inputs” to economic production) as efficiency increases, there is also increased net output of the economy as shown in Figure 6.

 
Figure 6. The net output, or GDP, of the model economy is about two times larger after the increase in capital resources consumption efficiency.    Solid line = constant η (constant efficiency).  Dashed line = decreasing η (increasing efficiency).


Clearly increased efficiency allows for (i) higher resource depletion, (ii) higher extraction rate of resources, (iii) an increased population, and (iv) more capital accumulation.  For the latter two stocks, population and capital, higher operational resource efficiency enables more resources to be allocated to the accumulation of both more people and capital that do more work.  This is consistent with the idea that more useful work, which is all energy inputs (technically exergy) times their full conversion efficiencies, goes hand in hand with more GDP.  Thus, by making choices to increase efficiency in the real economy, so far (globally to date) this has translated to more useful work, resource extraction, and net output (or GDP).

Figure 7 shows the real price of natural resources and goods (or machines).   With increasing efficiency (or decreasing η in the model), the price for a unit of natural resources increases relative to a constant efficiency world, and this is precisely the trend we’ve experienced for world oil prices that increased after the 1970s, when oil efficiency efforts started.  To date, oil prices have yet to return to the low prices experienced for the 90 years previous to 1974.  The price of goods (or machines) decreases with the increasing efficiency in their operation.


Figure 7. (a) The price of natural resources increases as η, the amount of resources to operate a unit of capital, decreases.  (b) The price of goods (or machines) decreases as η, the amount of resources to operate a unit of capital, decreases.   Solid line = constant η (constant efficiency).  Dashed line = decreasing η (increasing efficiency).


For the net energy geeks out there, Figure 8 shows the “net external power ratio”, or NEPR, which is the same concept that many people refer to as EROI = “energy return on (energy) invested”.  (See my previous publication for reasons why I prefer to use NEPR as a more specific term.)  Equation (2) expresses the idea behind the mathematics.


NEPR = (resource flows available for use outside of the extraction sector) /  (resource inputs to operate extraction capital + resource inputs to create new extraction capital)    (2)


When machines consume less resources for their operation, then there is period in which NEPR increases before reaching a maximum from which it again declines.  This increase in tandem with increasing efficiency represents an increased net resource flow available as “net output,” which in the economic sense is that output available for consumption and investment.


Figure 8. The net external power ratio (NEPR), often referred to as EROI (= energy return on (energy) invested), increases in response to an increase in capital operating efficiency since a higher fraction of total resource flows can temporarily go to net output.   Solid line = constant η (constant efficiency).  Dashed line = decreasing η (increasing efficiency).


Figure 9 shows the wage share, or percentage of GDP that is paid to wages, increases during the time that efficiency is increasing from about year = 50 to year = 110.  An increasing consumption of resources and GDP can thus translate to a higher (or at least a share decreasing at a slower rate) distribution to wages.

 
Figure 9. The share of GDP that is paid to wages (or workers).  Solid line = constant η (constant efficiency).  Dashed line = decreasing η (increasing efficiency).


Figure 10 shows that the debt ratio is temporarily lower while efficiency increases. Not shown (due to stopping the simulation) is that the debt ratio in the efficiency case also starts to decrease because resource constraints eventually inhibit investment below profits such that companies pay back debt.  See the paper for more details.  To understand the current economic situation in the U.S. and most OECD countries, it is critical to understand the context of high levels of private debt of companies and consumers (debt of consumers is not part of the HARMONEY 1.0 model).  Increasing efficiency can increase output faster than debt (hence lowering debt ratio), but only for a while. Ultimately, the second law of thermodynamics limits the efficiency of energy conversations.


Figure 10. The debt ratio (debt/GDP) of the economy increases more slowly while efficiency increases (e.g., decreasing η).    Solid line = constant η (constant efficiency).  Dashed line = decreasing η (increasing efficiency).


Summary

The HARMONEY model shows many trends that are indicative of the real world economy.  Thus far, globally, we keep making end-use devices more efficient, and we keep consuming energy at higher rates. When η is decreased, or efficiency is increased, in the HARMONEY model, resource extraction increases, population increases, capital increases, and net output increases.  Increasing efficiency is a tactic to increase consumption and output, not a tactic to reduce overall resource consumption.  The Jevons Paradox is only a paradox to those who are not thinking about the dynamics of the economy and how it responds to changes in efficiency over time.

How Wages are linked to Energy Consumption: Data and Theory

Introduction

How do economic analyses account for the roles and impacts of both the cost and quantity of natural resource consumption?

This question has been debated perhaps as long as there has been the profession of economics.  Before the use of fossil fuels, early “classical” economists knew that most products of interest, such as food and building materials, came from the land as it harnesses the energy from the sun. Thus, land as a natural resource was front-and-center to economic thinking.

With industrialization and the use of fossil fuels (that provide energy independent of current sunlight) economic analyses became less focused on the role of natural resources as an input into economic production such that in the 1900s most mainstream (i.e., Neoclassical) growth models do not directly account for energy and natural resources.  Many researchers, including myself, think we must explicitly consider the use of natural resources if we are to understand economic growth and the distribution of the stocks (e.g., debt) and flows (e.g., wages, profits) of money within the economy.

I have recently published a paper on my economic growth model that consistently and simultaneously accounts for both the use of natural resources, such as energy, and debt. 

The paper sheds new light on some of the most important contemporary economic trends in the United States and other economies of the OECD.  In particular, the model provides the foundation to directly link changes in the rate of energy consumption to increases in wage inequality and debt that began during the 1970s.

This publication is in a 2020 volume of the journal Ecological Economics asAn Integrated Biophysical and Economic Modeling Framework for Long-Term Sustainability Analysis: the HARMONEY Model”.   The name of the model, “HARMONEY,” is an acronym for “Human And Resources with MONEY.”


Model Results Reflect Trends in U.S. Data

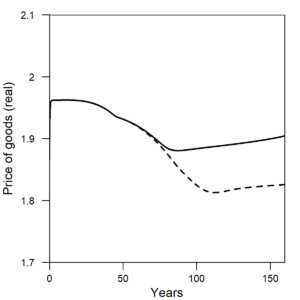
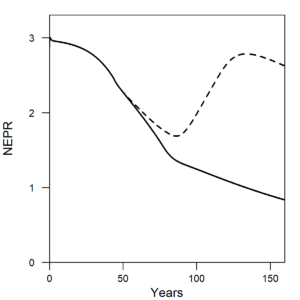
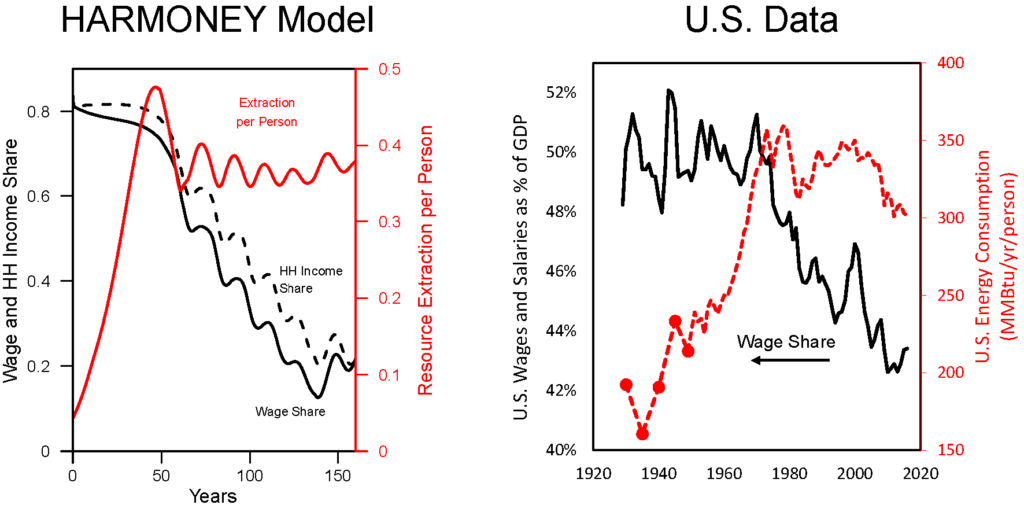
Figures 1 and 2 show comparisons of model results to U.S. data.  For these comparisons the qualitative similarities in the general sequence of long-trends and structural change are important, not the relation of magnitudes of variables or specific model times to specific years in the U.S. data.

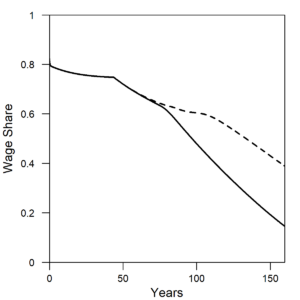
Figure 1 shows the wage share and per capita energy consumption of the U.S. The wage share is the percentage of GDP allocated to hourly or salaried workers. Notice how both the wage share and per capita energy consumption have a different trend before versus after the early 1970s. Before 1973, wage share remained constant at about 50% of GDP, and energy consumption per person increased at 3%/yr. After 1973, wage share declined at about 1.5-2% per decade as energy consumption per person declined slightly or remained relatively constant.

 
(a) (b)
Figure 1. (a)  In the same way as the U.S. data, the wage share (left axis) from the HARMONEY model shows the same simultaneous turning point in long-term trend, from a constant value to a declining value, when per capita resource consumption reaches its peak.  (b) Data for the U.S. wage share (left axis) and per capita energy consumption (right axis) both change their long-term trends in the 1970s.

The model results show practically the exact same trends as in the U.S. data.  When initially formulating the model, I had no immediate goal to mimic this type of relationship. I did want a model that had several important elements, but I didn’t anticipate my first results would so clearly relate to real world data. In the HARMONEY model, the wage share emerges because of how its systems-oriented structure relates the elements to one another, as described further below.

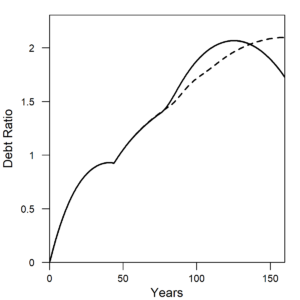
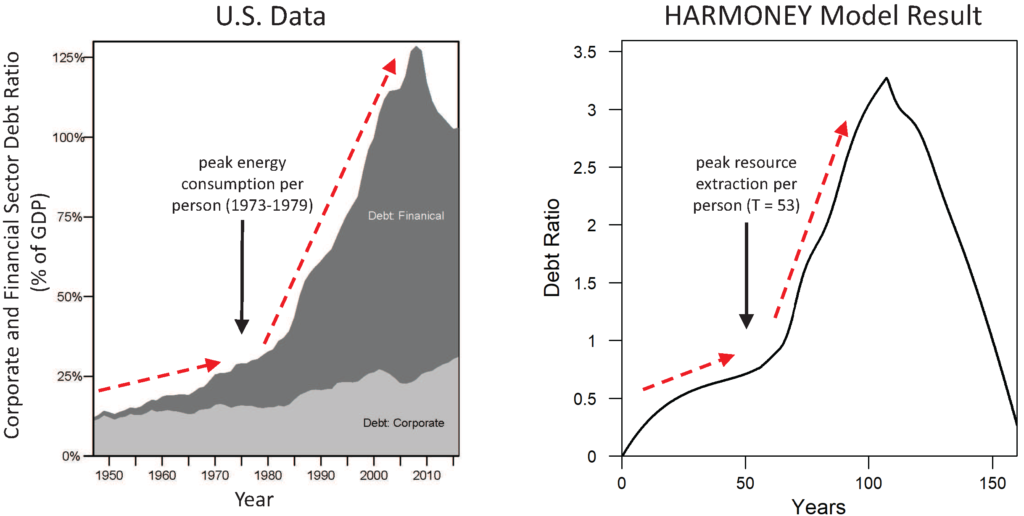
The HARMONEY model also provides insight into debt accumulation. Figure 2 shows private U.S. debt in terms of the debt ratio (debt divided by GDP) for corporations and financial institutions. These two categories are equivalent to the concept of debt included in the model. It was the accumulation U.S. private debt (and household debt in mortgages) and associated interest payments that triggered the 2008 Financial Crisis. The crisis was not triggered by government debt.

The new insight from this research is that it shows how increasing debt ratios can arise from a slowdown in resource consumption rates.  In essence a debt crisis cannot be analyzed independently of the longer-term context of natural resource consumption.

(a) (b)
Figure 2. Both the (a) U.S. data and (b) HARMONEY model show a slow rise in private debt ratio before a more rapid increase. The transition occurs soon after the peak in per capita energy consumption for the U.S. and peak in resource extraction per person for the model. U.S. data are from U.S. Federal Reserve Bank z.1 Financial Accounts of the United States, Table L.208 (Debt, listed as liabilities by sector). Model results are from the scenario labeled as “Renewable-High(b)” in the paper.

Note how private debt ratio increases much more rapidly after the 1970s than before, and the increase in financial sector debt drives the overall trend for the U.S. This same breakpoint occurs in the HARMONEY model and for the same reasons. In both the U.S. data and the model, when per capita resource consumption was rapid, the debt ratio increased but at a much slower rate than after per capita consumption stagnated.  Note that “mainstream” neoclassical economic theory does not account for the concept of debt, and it assumes the quantity of money has no fundamental role in long-term trends. Steve Keen’s research provided a simple way to include debt into economic growth modeling. In his 2011 book Debunking Economics, Keen states the problem clearly:

“This [lack of consideration of debt], along with the unnecessary insistence on equilibrium modeling, is the key weakness in neoclassical economics: if you omit so crucial a variable as debt from your analysis of a market economy, there is precious little else you will get right.” –– Steve Keen (2011)

This lack of consideration of debt is the fundamental reason why mainstream economists could not foresee or anticipate the 2008 Financial Crisis. Their theory tells them not to model debt, the direct cause of the crisis itself!


More Details on the Results

For those that want more details that explain these model results, then you can keep reading.  Also, at the bottom of this blog I provide links to videos where I describe the model structure and results.

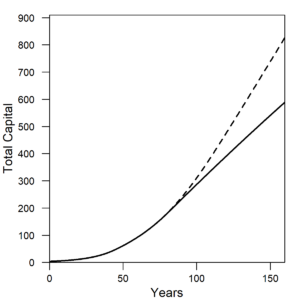
The wage share decline is driven by two quantities: the accounting for depreciation for an increasing quantity of capital and the interest payments on a rising debt ratio. The pattern occurs if you assume, as observed in the U.S. data, that companies keep investing more money than their profits. Since the 1920s, U.S. corporations typically invest 1.5 to 2.5 times more each year than they make in profits. Thus, in this face of constant or slower increase in total energy consumption, the economy accumulates capital that either operates less or requires less energy to operate (e.g., efficient equipment, computers).

Think about the patterns in Figures 1 and 2 the following way. We can assume four major distributions from GDP (or ‘value added’) in national economic accounting: government (as taxes), private profits including interest (or rent) payments to capital owners, depreciation (on capital), and wages (to workers).

In a capitalist system based on maintaining private sector profits, if both the debt ratio and the amount of capital per person increase, then increasing shares of GDP go to two categories: depreciation and interest payments. To minimize interest payments at high debt, you must lower the interest rate, and that is why central bank interest rates have remained at historic lows, sometimes even negative, since 2008.  Assuming a constant share of GDP to government taxes, when there is a restriction in the growth rate of GDP and energy consumption, the prioritization of profits, taxation, and depreciation means that the workers’ share is the only portion available to take the hit.

A short trip down memory lane provides the context for why I’ve performed this research.

In 1972, the book The Limits to Growth brought an idea mainstream discussion: physical growth on a finite plant cannot continue.  There were both detractors and proponents of the conceptual and mathematical models used in the book. When the authors updated the modeling in their 1992 Beyond the Limits, William Nordhaus (Nobel Laureate awarded in 2018) again critiqued the approach as he’d done in 1973 in his paper Lethal model 2: The limits to growth revisited.  Whether any “limits to growth” exist is contested in the economic literature, but there is little doubt in the ecological literature.  Many, including Ugo Bardi in his The Limits to Growth Revisited, state that the critiques of Nordhaus were ignorant of the mathematical and computational methods used in The Limits to Growth models.  However in a commentary within Nordhaus’ 1992 critique, Martin Weitzman effectively summarized the differences in worldviews between an ecological approach to economics and the mainstream view:

“There may be a some value in trying to understand a little better why the advocates of the limits-to-growth view see things so differently and what, if anything, might narrow the differences.

I think that there are two major differences in empirical world views between mainstream economists and anti-growth conservationists. The average ecologist sees everywhere that carrying capacity is a genuine limit to growth. Every empirical study, formal or informal, confirms this truth. And every meaningful theoretical model has this structure built in. Whether it is algae, anchovies, or arctic foxes, a limit to growth always appears. To be sure, carrying capacity is a long-term concept. There may be temporary population upswings or even population explosions, but they always swing down or crash in the end because of finite limits represented by carrying capacity. And Homo sapiens is just another species-one that actually is genetically much closer to its closest sister species, chimpanzees, than most animals are to their closest sister species.

Needless to say, the average contemporary economist does not readily see any long-term carrying capacity constraints for human beings. The historical record is full of past hurdles to growth that were overcome by substitution and technological progress. The numbers on contemporary growth, and the evidence before one’s eyes, do not seem to be sending signals that we are running out of substitution possibilities or out of inventions that enhance productivity.” — Martin Weitzman (1992)

Per Weitzman, I have been interested in “narrowing the differences” between economic and ecological worldviews by coherently including them in the same framework.  It was with that goal in mind that I created the model summarized in this article.  The model is based on a similar concept as that in The Limits to Growth in that it has an allocation of resources and capital between the “resource extraction” and “other” parts of the economy.  But to better communicate with economists it also includes economic factors such as debt and wages. Without this type of combination we can’t understand if and how energy and resource consumption play a role in the trends of debt ratios and wage inequality that now dominate contemporary social, economic, and political discussion.

It is easier to propagate the meme of your model if you give it a memorable name, so I called my model HARMONEY for “Human And Resources with MONEY”. The HARMONEY model is a combination of two other existing models. The first is a simple model of an agrarian society that harvests a forest-like resource to feed itself. The second is a model of a simple economy with fluctuating business cycles, tracking capital, wages, and employment, while also considering the real world tendency of businesses to invest more than their profits by borrowing money from a bank. This borrowing is what “creates money” as debt within the model, just like commercial banks create money when they provide a loan to a business.

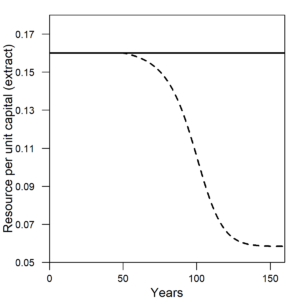
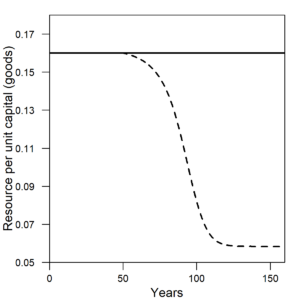
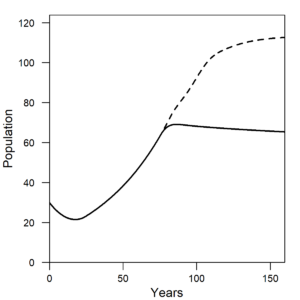
From the standpoint of natural resource use, HARMONEY has three key features that are consistent with real-world physical activities and that drive the patterns in Figures 1 and 2. First, natural resources are required to operate capital. This is the same as saying you need fuel to run your car, and a factory needs electricity to operate manufacturing machinery and computers.  Second, natural resources are required to make new capital. This is the same as saying that all of the objects around you now (coffee mugs, computers, buildings, etc.) are made of natural resources. Third, natural resources are required to sustain human livelihood. This is the same as saying that, at a very basic level we need food to survive, and at a higher level more resource consumption leads to more longevity. Thus, whatever the flow of natural resources, those resources must be allocated between the three aforementioned uses.

These three features for modeling the use of natural resources, combined with the concept of private debt as loans from banks, give us tremendous insight into contemporary economic discussions.


Links for Further Exploration

For further learning you can access the article directly and watch videos of me presenting the model background and results in videos (video 2018video 2019) via my website: http://careyking.com/publications/ and http://careyking.com/presentations/.

Artificial Intelligence and the Utility Monster: It’s the Economy Stupid

In his 2014 book Superintelligence: Paths, Dangers, and Strategies, Nick Bostrom discussed issues related to whether we could prevent a superintelligent artificial intelligence (AI) computer system from posing an existential risk to humanity.  In 2014 he also presented for Talks at Google. In that presentation, an audience member (at 49 min 35 sec) posed the idea that a superintelligent computer could become a utility monster.  The utility monster is an idea of philosopher Robert Nozik, and it relates to the philosophical concept of utilitarianism.

In utilitarianism, only the maximum happiness, or utility, of the group is what matters. The distribution of utility within the group does not matter. Consider the idea of marginal utility which is how much utility comes from consuming the next increment of resources.  Because the superintelligent AI system might be much smarter than all of humanity, it could have a higher marginal utility than that of humans.  The machine could conclude that total utility was maximized by its consuming one-hundred percent of natural resources because in doing so, it could maximize overall utility simply by maximizing its own utility.

Bostrom then discussed the paper clip maximizer as a classic AI thought experiment. What if the superintelligent AI system only tries to maximize the number of paper clips (the paper clip is an arbitrary placeholder)? The AI system would likely determine that keeping humans alive is detrimental to the goal of maximizing the number of paper clips in the world. Humans need resources to survive, and these resources could be used to make more paper clips.  It is not that the AI machine dislikes or specifically tries to harm humanity. It is just that the superintelligent AI system is indifferent to our existence.

Now think about “the economy” and the metric of gross domestic product (GDP) which is usually used as a metric of the size, or throughput, of the economy. GDP is roughly treated as utility in economics. GDP is now a substitute for paper clips. Could we tell the difference between a world that is run by a superintelligent GDP maximizer and the world that we live in right now?  That is to say if certain politicians, business owners and executives, and economists are pushing for rules that maximize GDP with , then is that “the economy” simply a mechanism to maximize GDP without regard for how money is distributed?

Philip Mirowski points out that one of Friedrich Hayek’s ideas was that the economy was smarter than any one person or group of persons. Government officials, for example, can’t know enough to make good economic decisions. Mirowski discusses Hayek’s idea in his book The Road from Mont Pelerin which explores the history of the “neoliberal thought collective”.  Mirowski points out that Hayek saw the economy as the ultimate information processor.  Thus, markets are able to aggregate data in the most effective way to produce the “correct” signal, say the price, to direct people on what to make and what to buy.

Need better decisions? Make another market! There is little to no need for people to think.

In an extreme world with markets for everything, each of us becomes an automaton responding to price signals to maximize collective utility, or GDP, that might have very little to do with our personal well-being.

How could we know if we have allowed the economy to simply become a GDP maximizing utility monster? Perhaps GDP would keep going up, but if it didn’t, perhaps we’d start adding activities to GDP that have existed for centuries, but had previously not been counted due to illegality or other reasons. Prostitution and legalizing previously drugs are examples. Check on that one.

Perhaps if all we wanted to do was increase GDP, we’d cut corporate taxes to spur investment in capital versus spending on education, which is for people. Perhaps human life expectancy would go down, and drug sales would be up (the utility monster is indifferent to people). Perhaps we’d see increases in wealth or income inequality. Perhaps people would contract with “transportation network companies” to drive around, wait for algorithmic signals on where to drive to pick up a person or thing, and then deliver that person or thing as directed.

Most macroeconomic analyses are based upon the concept of maximizing utility, which is usually interpreted as the value of what “we” consume over all time into the future.  Many interesting (troubling to many) trends are occurring in the U.S. regarding health, distribution of income, and the ability of people to separate concepts of fact and truth. Thus, we should consider whether the superintelligent AI future some fear might already in action, but at perhaps a slower and more subtle pace than some pontificate might happen after “the singularity” when AI becomes more capable than humans.

The recent populist political movements in the U.S. and other countries could in fact be a rejection of the “algorithm of GDP maximization” associated with our current economic system.

Learn about utilitarianism.  Learn to go beyond GDP here, here, and here.

A Lack of Systematic Thinking Keeps America from Staying Great

The following is an Energy Institute commentary piece coauthored with Dr. Josh Rhodes also of the University of Texas at Austin Energy Institute, January 2018.

Our economic system operates within intellectual, social, and physical constraints. Each of these constraints can feedback to affect the others. To produce more goods and services we have to 1) know how to produce them, 2) make them desirable, acceptable and affordable, and 3) have the required natural resources.  The finite size of the Earth increasingly affects socioeconomic outcomes across the globe, including within the developed economies.

Ecologists, anthropologists, and systems scientists have anticipated this since the 1970s.  However, the physical constraints on societal and economic organization and equality are largely unappreciated and misunderstood.

Click here to read the full commentary

Pipeline, Standing Rock conflict is all about power

The following is the text of an opinion editorial I wrote that was placed in many major Texas newspapers on December 8, 2016. I also include comments received via e-mail, from readers, and only include names when persons specifically gave permission to do so.

Links to version in Austin American StatesmanHouston Chronicle, Dallas Morning News

The recent decision by the President Barack Obama’s Administration, via the Army Corps of Engineers, to ask for a more in-depth environmental impact statement regarding a final section of the Dakota Access oil pipeline represents a clash of power.  The simple story is one of environmental and health concerns, but in reality the full story is much more. It is a continuation of the populist fervor building up in the United States.  It is a continuation of the pursuit of infinite growth. It is a story of physical power, political power and economic power.

The pipeline is designed to transport 570,000 barrels per day of U.S. light sweet from the Bakken and Three Forks production region of North Dakota to Patoka, Ill.  That is 40 gigawatts of power, or the output of 20 nuclear power plants. A power level equal to more than half of the peak electric load in Texas on the hottest summer day, an amount of power that is not trivial.

This amount of physical power flow does not go unnoticed by those who lack economic and political power. In the early days of the fossil fuel age, a small group of people could restrict the flow of coal, and thus significant physical power.  Those that can restrict or control of physical power can command economic power, and those in control of economic power, can command political power.  The Dakota Access pipeline is no different.

In short, it is all about power.

Thus, by challenging the physical flow of power, the Standing Rock tribe challenged the current economic and political power.  After months of protest, they saw local law enforcement treat them as the first African Americans integrated into southern universities: with tear gas, rubber bullets, and water cannons. These Native Americans, and those joining them, were on a slow path to defeat with orders to vacate the protest camp. They simply did not represent enough political or economic power.

However, the power struggle turned in their favor as soon as a new political power arrived in the form of a group of 2,000 military veterans.  Firing tear gas and water cannons at Native Americans is bad for business. Doing the same to military veterans is a public relations nightmare for business and politicians.

Obama’s decision on Dakota Access is an easy one to make as the outgoing President, and at the onset of winter in North Dakota.

As president-elect Donald Trump discusses approving the Dakota Access pipeline route, attempting to reverse the decision of his predecessor as quickly as possible, it will test his populist credentials that he sold to the American public.  More physical power (e.g., oil flow) does translate to a larger economy. The oil in the ground is no use if it cannot flow to the pump.  But alas, there is also less use in gasoline flowing to the pump if fewer and fewer people can afford to use it. More power flowing to fewer pockets is not what Trump claims to promote.

The Keystone XL oil pipeline debate centered on carbon and climate concerns and from where our physical power originates. The voters in Wisconsin, Ohio, and Michigan that help put Trump in White House were not thinking about climate change.  These Americans felt left behind by increased global competition.  They lost economic power and control over their lives. Trump told them he would give both back to them, whether that actually happens remains to be seen.

The Dakota Access pipeline concerns the same story. It’s about the power people to be in control of decisions that affect their lives.  The Native Americans, protestors, and veterans in North Dakota showed up as a test of power of the local people against broader business interests. They won this battle, but if history is any indication, they likely will not win the war for stopping or rerouting the pipeline. Obama bought them some time.  Only time will tell just exactly what Trump will buy for them and thus which citizens of America he is helping to be great again. Trump needs to let us know if he thinks there is equal power for ensuring a right-of-way versus the right to get in the way.

Carey King is a research scientist and the assistant director of the Energy Institute at The University of Texas at Austin.

Energy Giant Shell Says Oil Demand Could Peak in Just Five Years – Commentary

This blog refers to the following recent Bloomberg article on “peak oil demand” and also, MarketPlace on November 16 even made the incorrect case that “peak oil demand”, driven by increases in efficiency, is somehow different than “peak oil” in general: it isn’t, peak oil (demand if you will) is related to budget constraints that are ultimately stemmed from resource constraints …

(http://www.bloomberg.com/news/articles/20161102/europesbiggestoilcompanythinksdemandmaypeakin5years)

I’ll comment on two quotes from the Bloomberg article.

FIRST: From the article is the following quote:

“We’ve long been of the opinion that demand will peak before supply,” Chief Financial Officer
Simon Henry said on a conference call on Tuesday. “And that peak may be somewhere between 5 and 15 years hence, and it will be driven by efficiency and substitution, more than offsetting the new demand for transport.”

I’ve commented on this before with regard to people discussing peak oil.  Over the long-term, there is no difference between peak supply and peak demand.  In order for Shell and others to extract more oil, consumers need to want and be able to purchase the refined products from that oil.  Peak supply is defined by peak demand as much as peak demand is defined by peak supply.   Ideally both supply and demand follow each other.  But if they don’t to an “extreme”, then there are lower profits and layoffs in the industry (supply > demand) or recession can happen if demand > supply to a large enough extent (e.g., due to price rise in oil without time to substitute).

Thus, peak oil demand (which we can’t actually define demand due to lack of data) IS a response to oil supply constraints and (a finite Earth more generally) in the long-term.  If not, what else is responsible for the lack of purchasing power of consumers?  If U.S. workers were getting paid higher incomes AND deciding not to purchase more oil AND working normal 40-hour work weeks, then we’d would have a reason to think about whether demand was being tempered by choice. Until then, the most logical conclusion is that consumer budgets are constrained, and these constrained budgets are not independent of resource constraints and increased difficulty for companies to make profits (thus lower margins and lower wages to save even those low margins).


SECOND: On the topic of biofuels and hydrogen replacing oil

“Shell will be in business for “many decades to come” because it is focusing more on natural gas
and expanding its newenergy businesses including biofuels and hydrogen, Henry said.
“Even if oil demand declines, its replacements will be in products that we are very well placed to
supply one way or the other, so we need to be the energy major of the 2050s,” Henry said. “That
underpins our strategic thinking. It’s part of the switch to gas, it’s part of what we do in biofuels,
both now and in the future.”

While Simon Henry is not directly quoted here in discussing hydrogen as a substitute for oil, he does discuss biofuels.  This is an absurd assertion that there will can simultaneously be a peak in demand for liquid fuels from petroleum but that for some reason consumers would still be able to afford to substitute biofuels (that have much lower net energy and are restricted by land use, even algae is limited due to low net energy) or hydrogen (which is not a primary fuel and is difficult to store).

I do believe the world will continue to electrify (via renewable electricity) to reduce demand on hydrocarbons which can be used for physical material feedstocks as well as fuels. But please, let’s not tell people … still … that biofuels and hydrogen can substitute for oil anywhere in the next several decades.  We need to have invested much much more into hydrocarbon-efficient end-use devices (e.g., electric vehicles) before we can afford even a fraction of current developed world lifestyles if we power any decent percentage of our economy on biofuels and hydrogen.

Always remember, it is “energy price” x “energy consumption” = “energy expenditures”, compared to incomes and GDP that determine whether or not energy is expensive.  To afford higher prices (e.g., $/BBL) you need to become more efficient for each BBL, and that efficiency is not at zero investment costs.