Introduction
How do economic analyses account for the roles and impacts of both the cost and quantity of natural resource consumption?
This question has been debated perhaps as long as there has been the profession of economics. Before the use of fossil fuels, early “classical” economists knew that most products of interest, such as food and building materials, came from the land as it harnesses the energy from the sun. Thus, land as a natural resource was front-and-center to economic thinking.
With industrialization and the use of fossil fuels (that provide energy independent of current sunlight) economic analyses became less focused on the role of natural resources as an input into economic production such that in the 1900s most mainstream (i.e., Neoclassical) growth models do not directly account for energy and natural resources. Many researchers, including myself, think we must explicitly consider the use of natural resources if we are to understand economic growth and the distribution of the stocks (e.g., debt) and flows (e.g., wages, profits) of money within the economy.
I have recently published a paper on my economic growth model that consistently and simultaneously accounts for both the use of natural resources, such as energy, and debt.
The paper sheds new light on some of the most important contemporary economic trends in the United States and other economies of the OECD. In particular, the model provides the foundation to directly link changes in the rate of energy consumption to increases in wage inequality and debt that began during the 1970s.
This publication is in a 2020 volume of the journal Ecological Economics as “An Integrated Biophysical and Economic Modeling Framework for Long-Term Sustainability Analysis: the HARMONEY Model”. The name of the model, “HARMONEY,” is an acronym for “Human And Resources with MONEY.”
Model Results Reflect Trends in U.S. Data
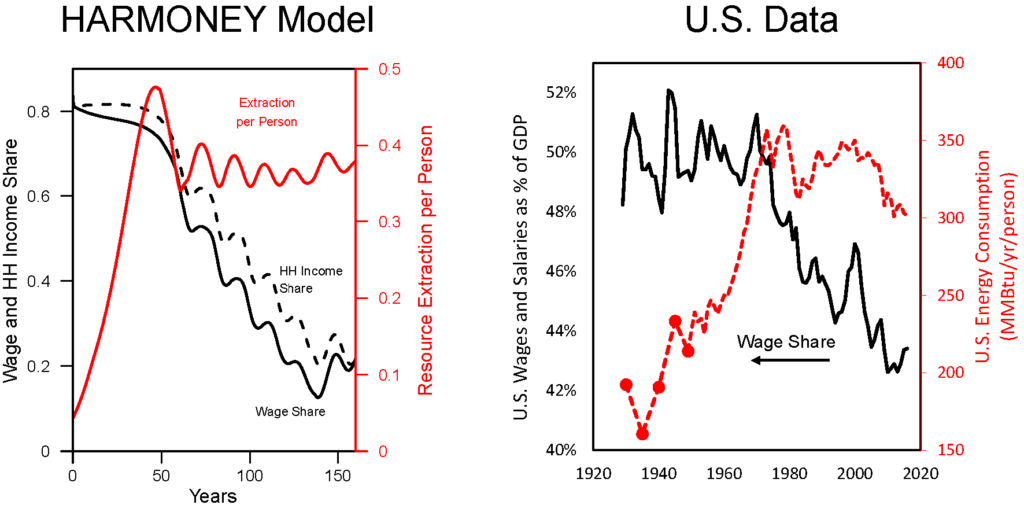
Figures 1 and 2 show comparisons of model results to U.S. data. For these comparisons the qualitative similarities in the general sequence of long-trends and structural change are important, not the relation of magnitudes of variables or specific model times to specific years in the U.S. data.
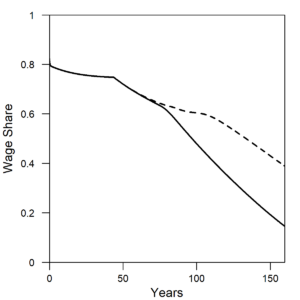
Figure 1 shows the wage share and per capita energy consumption of the U.S. The wage share is the percentage of GDP allocated to hourly or salaried workers. Notice how both the wage share and per capita energy consumption have a different trend before versus after the early 1970s. Before 1973, wage share remained constant at about 50% of GDP, and energy consumption per person increased at 3%/yr. After 1973, wage share declined at about 1.5-2% per decade as energy consumption per person declined slightly or remained relatively constant.
 |
| (a) |
(b) |
| Figure 1. (a) In the same way as the U.S. data, the wage share (left axis) from the HARMONEY model shows the same simultaneous turning point in long-term trend, from a constant value to a declining value, when per capita resource consumption reaches its peak. (b) Data for the U.S. wage share (left axis) and per capita energy consumption (right axis) both change their long-term trends in the 1970s. |
The model results show practically the exact same trends as in the U.S. data. When initially formulating the model, I had no immediate goal to mimic this type of relationship. I did want a model that had several important elements, but I didn’t anticipate my first results would so clearly relate to real world data. In the HARMONEY model, the wage share emerges because of how its systems-oriented structure relates the elements to one another, as described further below.
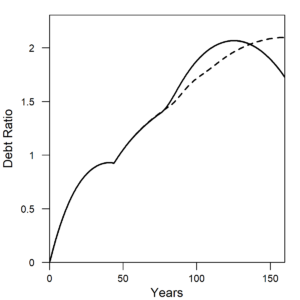
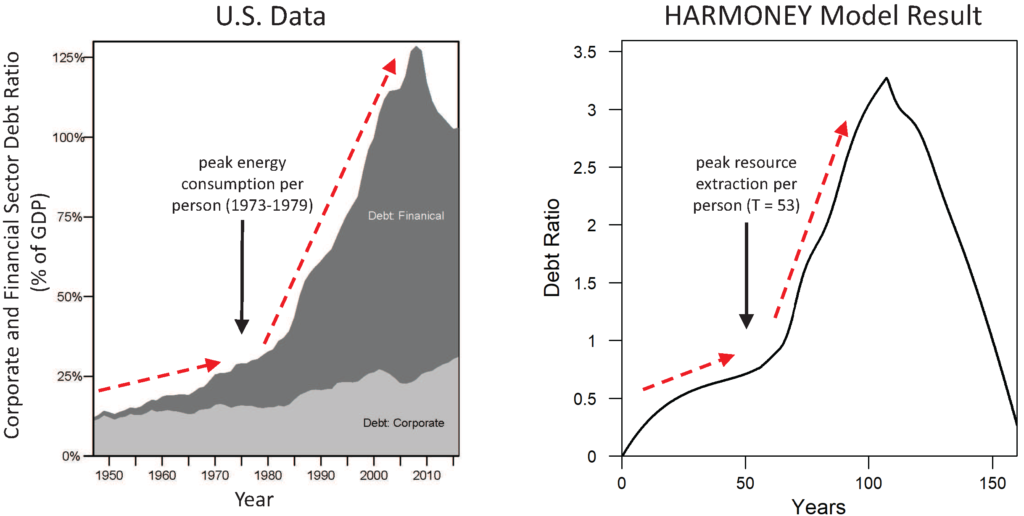
The HARMONEY model also provides insight into debt accumulation. Figure 2 shows private U.S. debt in terms of the debt ratio (debt divided by GDP) for corporations and financial institutions. These two categories are equivalent to the concept of debt included in the model. It was the accumulation U.S. private debt (and household debt in mortgages) and associated interest payments that triggered the 2008 Financial Crisis. The crisis was not triggered by government debt.
The new insight from this research is that it shows how increasing debt ratios can arise from a slowdown in resource consumption rates. In essence a debt crisis cannot be analyzed independently of the longer-term context of natural resource consumption.
 |
| (a) |
(b) |
| Figure 2. Both the (a) U.S. data and (b) HARMONEY model show a slow rise in private debt ratio before a more rapid increase. The transition occurs soon after the peak in per capita energy consumption for the U.S. and peak in resource extraction per person for the model. U.S. data are from U.S. Federal Reserve Bank z.1 Financial Accounts of the United States, Table L.208 (Debt, listed as liabilities by sector). Model results are from the scenario labeled as “Renewable-High(b)” in the paper. |
Note how private debt ratio increases much more rapidly after the 1970s than before, and the increase in financial sector debt drives the overall trend for the U.S. This same breakpoint occurs in the HARMONEY model and for the same reasons. In both the U.S. data and the model, when per capita resource consumption was rapid, the debt ratio increased but at a much slower rate than after per capita consumption stagnated. Note that “mainstream” neoclassical economic theory does not account for the concept of debt, and it assumes the quantity of money has no fundamental role in long-term trends. Steve Keen’s research provided a simple way to include debt into economic growth modeling. In his 2011 book Debunking Economics, Keen states the problem clearly:
“This [lack of consideration of debt], along with the unnecessary insistence on equilibrium modeling, is the key weakness in neoclassical economics: if you omit so crucial a variable as debt from your analysis of a market economy, there is precious little else you will get right.” –– Steve Keen (2011)
This lack of consideration of debt is the fundamental reason why mainstream economists could not foresee or anticipate the 2008 Financial Crisis. Their theory tells them not to model debt, the direct cause of the crisis itself!
More Details on the Results
For those that want more details that explain these model results, then you can keep reading. Also, at the bottom of this blog I provide links to videos where I describe the model structure and results.
The wage share decline is driven by two quantities: the accounting for depreciation for an increasing quantity of capital and the interest payments on a rising debt ratio. The pattern occurs if you assume, as observed in the U.S. data, that companies keep investing more money than their profits. Since the 1920s, U.S. corporations typically invest 1.5 to 2.5 times more each year than they make in profits. Thus, in this face of constant or slower increase in total energy consumption, the economy accumulates capital that either operates less or requires less energy to operate (e.g., efficient equipment, computers).
Think about the patterns in Figures 1 and 2 the following way. We can assume four major distributions from GDP (or ‘value added’) in national economic accounting: government (as taxes), private profits including interest (or rent) payments to capital owners, depreciation (on capital), and wages (to workers).
In a capitalist system based on maintaining private sector profits, if both the debt ratio and the amount of capital per person increase, then increasing shares of GDP go to two categories: depreciation and interest payments. To minimize interest payments at high debt, you must lower the interest rate, and that is why central bank interest rates have remained at historic lows, sometimes even negative, since 2008. Assuming a constant share of GDP to government taxes, when there is a restriction in the growth rate of GDP and energy consumption, the prioritization of profits, taxation, and depreciation means that the workers’ share is the only portion available to take the hit.
A short trip down memory lane provides the context for why I’ve performed this research.
In 1972, the book The Limits to Growth brought an idea mainstream discussion: physical growth on a finite plant cannot continue. There were both detractors and proponents of the conceptual and mathematical models used in the book. When the authors updated the modeling in their 1992 Beyond the Limits, William Nordhaus (Nobel Laureate awarded in 2018) again critiqued the approach as he’d done in 1973 in his paper Lethal model 2: The limits to growth revisited. Whether any “limits to growth” exist is contested in the economic literature, but there is little doubt in the ecological literature. Many, including Ugo Bardi in his The Limits to Growth Revisited, state that the critiques of Nordhaus were ignorant of the mathematical and computational methods used in The Limits to Growth models. However in a commentary within Nordhaus’ 1992 critique, Martin Weitzman effectively summarized the differences in worldviews between an ecological approach to economics and the mainstream view:
“There may be a some value in trying to understand a little better why the advocates of the limits-to-growth view see things so differently and what, if anything, might narrow the differences.
I think that there are two major differences in empirical world views between mainstream economists and anti-growth conservationists. The average ecologist sees everywhere that carrying capacity is a genuine limit to growth. Every empirical study, formal or informal, confirms this truth. And every meaningful theoretical model has this structure built in. Whether it is algae, anchovies, or arctic foxes, a limit to growth always appears. To be sure, carrying capacity is a long-term concept. There may be temporary population upswings or even population explosions, but they always swing down or crash in the end because of finite limits represented by carrying capacity. And Homo sapiens is just another species-one that actually is genetically much closer to its closest sister species, chimpanzees, than most animals are to their closest sister species.
Needless to say, the average contemporary economist does not readily see any long-term carrying capacity constraints for human beings. The historical record is full of past hurdles to growth that were overcome by substitution and technological progress. The numbers on contemporary growth, and the evidence before one’s eyes, do not seem to be sending signals that we are running out of substitution possibilities or out of inventions that enhance productivity.” — Martin Weitzman (1992)
Per Weitzman, I have been interested in “narrowing the differences” between economic and ecological worldviews by coherently including them in the same framework. It was with that goal in mind that I created the model summarized in this article. The model is based on a similar concept as that in The Limits to Growth in that it has an allocation of resources and capital between the “resource extraction” and “other” parts of the economy. But to better communicate with economists it also includes economic factors such as debt and wages. Without this type of combination we can’t understand if and how energy and resource consumption play a role in the trends of debt ratios and wage inequality that now dominate contemporary social, economic, and political discussion.
It is easier to propagate the meme of your model if you give it a memorable name, so I called my model HARMONEY for “Human And Resources with MONEY”. The HARMONEY model is a combination of two other existing models. The first is a simple model of an agrarian society that harvests a forest-like resource to feed itself. The second is a model of a simple economy with fluctuating business cycles, tracking capital, wages, and employment, while also considering the real world tendency of businesses to invest more than their profits by borrowing money from a bank. This borrowing is what “creates money” as debt within the model, just like commercial banks create money when they provide a loan to a business.
From the standpoint of natural resource use, HARMONEY has three key features that are consistent with real-world physical activities and that drive the patterns in Figures 1 and 2. First, natural resources are required to operate capital. This is the same as saying you need fuel to run your car, and a factory needs electricity to operate manufacturing machinery and computers. Second, natural resources are required to make new capital. This is the same as saying that all of the objects around you now (coffee mugs, computers, buildings, etc.) are made of natural resources. Third, natural resources are required to sustain human livelihood. This is the same as saying that, at a very basic level we need food to survive, and at a higher level more resource consumption leads to more longevity. Thus, whatever the flow of natural resources, those resources must be allocated between the three aforementioned uses.
These three features for modeling the use of natural resources, combined with the concept of private debt as loans from banks, give us tremendous insight into contemporary economic discussions.
Links for Further Exploration
For further learning you can access the article directly and watch videos of me presenting the model background and results in videos (video 2018, video 2019) via my website: http://careyking.com/publications/ and http://careyking.com/presentations/.
