Author Archives: CareyKing

The Minimum EROI (or net energy) to Maintain Society has to Define Society

Several authors have concerned themselves with the possible causal relationship between the energy return on energy invested (EROI) of one or all of the economy’s energy supplies and the state of the economy, or perhaps the stability, structure, or sustainability and well being of “society” more generally.  In this blog I point out some (but I don’t claim to be exhaustive) existing studies that attempt to link EROI and some aspect of “the economy” or “society”, and then show that due to its overall structure, my Human And Resources with MONEY (HARMONEY) model has an appropriate and sufficient overall structure (I’m claiming) to holistically provide insights as to how both resource depletion and economic decisions affect EROI and options for economic equality and structure more generally.  In short, one needs to coherently link both a biophysical description of natural (energy) resource extraction and use and a full monetary (stock and flow) description of the economy including a behavior for investment, or effective demand (could include a household behavior assumption).

Hall, Balogh, and Murphy (2009) discussed this, mostly in the context of oil converted into refined fuels.  Using some basic reasoning, but no formal model, they posited that oil extracted at the well needs an EROI ratio of at least 3:1. Brandt (2021) considered a simple 4-sector economy (energy, materials, food, and labor) scaled for the U.S. economy, and posited an EROI of the energy sector of less than 5:1 might start to significantly reduce discretionary energy for other economic purposes, thus triggering a restructuring of the economy, but without insight into household consumption or wages. He considers the “free fraction” of energy (e.g., what fraction is “net energy”) as well as the free fraction of mass of food, mass of materials, and hours of labor that might also similarly constraint the economy.  Lambert et al. (2014) discuss how EROI and energy per capita values seem to relate to quality of life indicators at the country level.

In general, these three studies, as well as a host of others, posit that a declining EROI (or net energy output of the energy system) could get so low that the economy reaches the “net energy cliff” such that a very small decrease in EROI causes an increasingly large decline in energy available for the non-energy part of the economy.   This conclusion is largely due to the nonlinear (or one of the) mathematical formulation of EROI = net energy/energy invested.   If defining “net energy” = “energy extracted from the environment – energy invested” = Eout – Einvested, then


EROI = (Eout – Einvested)/Einvested  (1)


If we assume Eout is constant at Eout = 100, then an EROI = 20 means Einvested = 4.8 and there are 95.2 units of energy for the non-energy part of the economy to use.  A decline in EROI of an increment of 1, to EROI = 19 means that Einvested = 5 and there are 95 units of net energy left over – a decline of only 0.2 units of net energy from EROI of 20 to 19 — not much difference.  Compare this to the scenario in which the EROI now changes from EROI = 5 to EROI = 4. In this case, Einvested changes from 16.7 to 20, and the net energy available declines from 83.3 to 80 for a seemingly similar decline in EROI of 1 (e.g., EROI from 5 to 4 instead of EROI from 20 to 19).  Regardless of this nonlinear change, how might this actually play out in an economy in terms of the major indicators of interest such as wages (and wage equality), gross domestic product (GDP), employment, and population?

To answer this type of question, we need macroeconomic models that have the proper framework.  HARMONEY has such a framework and I’ll highlight some modeling structures that are very similar to HARMONEY.  Two of these are the Jacques et al. (2023) TEMPLE model (“Tilting Economic Momentum for Progress to Low-carbon Energies”) and the Dafermos et al. (2017) DEFINE model (“Dynamic Ecosystem-FINance-Economy”).

TEMPLE, DEFINE, and HARMONEY, use stock-flow consistent modeling (SFC) frameworks.  Jacques et al. (2023) have a nice summary table of other so-called SFC models with similar structures. TEMPLE and HARMONEY run in continuous time (e.g., use ordinary differential equations) and DEFINE runs in discrete time (e.g., difference equations).  In terms of defining the EROI of energy resources, the TEMPLE model characterizes both renewable and nonrenewable resources, but they are exogenously specified to a large degree.  That is to say, Jacques et al. (2023) assume certain energy intensity (energy inputs per dollar of spending) for renewable and nonrenewable energy that is “exogenous” to other parameters in the model.  In other words, as the model runs, no other states in the model affect how EROI changes as a function of how much renewable or (cumulative) nonrenewable energy extraction occurs. This is a critical difference from HARMONEY in which I don’t exogenously assume any energy intensity relationship.  That is to say, HARMONEY does not a-priori assume a relationship between the monetary output of the economy (or an industry) and energy consumption.  While I see this as a theoretical advantage of HARMONEY, it causes some more work to calibrate such a model to the real world because the tradeoff is that you must assume (other) additional physical characteristics of natural resources.

The Dafermos et al. (2017) DEFINE model and HARMONEY are similar in that they both (as stated in their paper) combine “… the stock-flow consistent (SFC) approach of Godley and Lavoie (2007) with the flow-fund model of Georgescu-Roegen (1971, ch. 9; …”.  They also both conceptually describe the extraction and use of resources for both their material (or matter) and energy properties.  While Dafermos et al. (2017) have a better integration of both non-renewable and renewable energy than in my King (2020) HARMONEY paper (and my King (2022) HARMONEY paper does not model nonrenewable resources), I find their assumptions for the material intensity to perhaps not be realistic enough. They assume the material and energy intensities of “green” capital (renewable resources) exogenously improve over time, but those of “conventional” capital (nonrenewable resource) remain constant.  In principle (in my view) one cannot make this distinction because we should expect all energy technologies to be subject to some similar cost pressures driven by common inputs, including resource depletion and costs on various minerals (e.g., even common materials such as steel that is used both for drilling wells for hydrocarbons and constructing wind turbines and electric grid infrastructure).

Nonetheless “Essentially, all models are wrong, but some are useful.” (Box and Norman [p. 424]), and I definitely place both the TEMPLE and DEFINE models in the “useful” category!

One aspect that I’ve perhaps pursued more than others’ studies is some fundamental exploration of how EROI (the metric) relates to metrics of the “structure of society or the economy”.  I’ve already summarized five core insights from my King (2022) HARMONEY paper, and here I’m going to discuss one of those insights in more detail: the relationship between wages, resource consumption, and EROI.  I’ll also highlight a household consumption of “goods”, which I’ll use a proxy for general consumption and “well being” as much as you want to do so (i.e., I’m not saying physical consumption of stuff is the only important aspect of human well being).

Keep in mind that, within my discussion of each of the following figures and simulation results, nothing changes (unless specifically stated) regarding the characterization of the natural (energy) resource or its assumed relationships to forming capital and keeping the population alive. To make a new unit of capital, it must be made of resources. To operate capital, it must consume resources as fuel, and the population needs to consume the resource to stay alive.

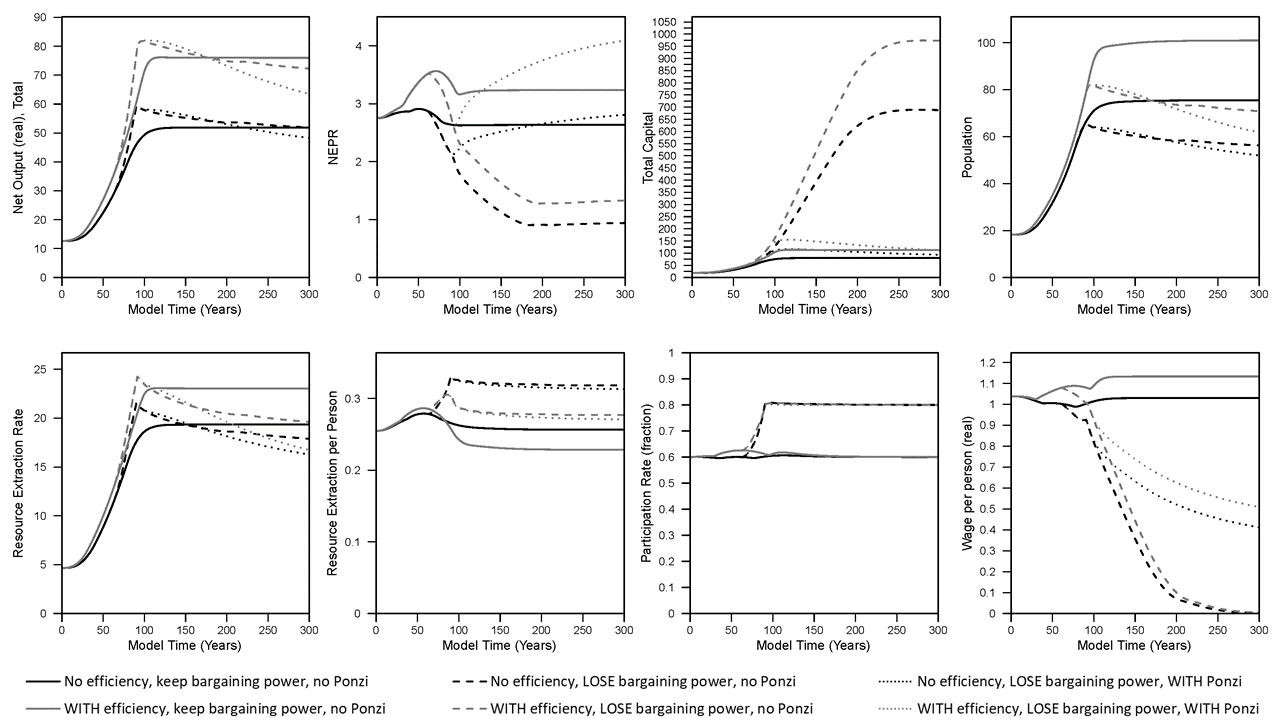
In all figures the black solid line is the baseline scenario.  It assumes wages always increase with inflation and capital (or machines) always consume the same amount of fuel to operate; in other words the capital always has the same energy efficiency. The economy grows from a steady state after assuming that there is an improvement in the technology to extract resources.

The plots in Figure 1 show that the amount of capital, population, and net output (or gross domestic product) increase to a higher steady state level.  These increases are associated with higher resource (e.g., energy) extraction rates and wages decline slightly during the growth phase before increasing back up to previous levels when growth slows.

Now consider what happens to the EROI ratio, or in the terminology I use, the Net External Power Ratio (NEPR).  NEPR is equal to “net power out / net power invested,” which is to say based on instantaneous flows of energy (i.e., power = energy/time).  More specifically to the terminology in the paper there is a natural resource that is used to make capital and can be used as fuel such that NEPR is “net resource output flow from the resource (energy) industry” divided by “resources consumed by the resource (energy) industry” where:

  • “net resource flow from the resource (energy) industry” = (resource extraction rate – resource consumption to extract resources – resource consumption for investment into capital that extracts resources)
  • “resources consumed by the resource (energy) industry” = (resource consumption to extract resources + resource consumption for investment into capital that extracts resources)


Figure 1. Results from simulations used in King (2022) (“full cost” pricing).


In the baseline (black solid line) scenario, NEPR (a.k.a. “dynamic EROI”) slightly rises and declines eventually settling at a value slightly lower than the start of the simulation.  If we assume that companies invest in more fuel-efficient machines (capital) up to a pre-defined limit, then this is the scenario represented by the gray solid line.  In this case of higher fuel efficiency, most indicators increase to higher levels: net output (GDP), capital, population, resource extraction rate, real wages, and NEPR.  While the per capita resource extraction rate of the economy (akin to primary energy supply) decreases slightly in the steady state, there is higher per capita household (HH) goods consumption (see Figure 2).  Consider this household goods consumption as the closest available metric to discretionary consumption (although the way the model works, there are no modeled decisions or behaviors by households).

Note that the steady state per capita HH natural resource consumption is the same in every scenario because that is what governs the death rate in the model.  In other words, if there is a non-zero stable population, by definition the simulation ends up at the same level of per capita HH natural resource consumption (about 0.053 units of resources per person in the model) that enables the death rate to equal the birth rate.

To summarize the effect of increasing fuel efficiency of machines, it enables higher stocks (population, capital), higher levels of total extraction and consumption in the overall economy, higher goods (or discretionary) consumption, higher wages, and higher NEPR (or steady state “dynamic EROI”).  And for this effect, I didn’t assume any changes to the characterization of the natural resource itself.  I only considered changes in the fuel efficiency of both types of machines in the model: those that extract resources and those that make more machines (or goods).
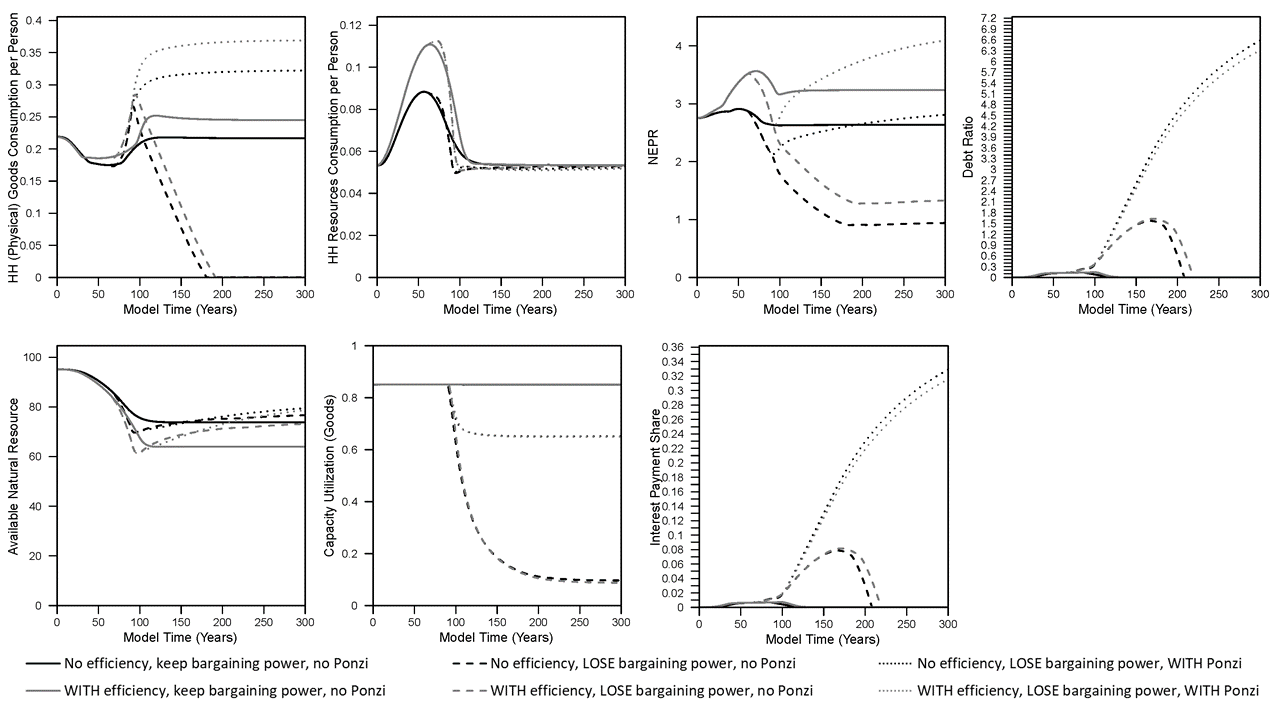
Figure 2. Results from simulations used in King (2022) (“full cost” pricing).

Further, recall that in obtaining these insights from running the model, I do not assume any fixed trajectory (in time, or relative to extraction rates) for resource intensity (extraction rate / GDP) or NEPR itself.  I don’t actually know the metrics of NEPR or resource intensity until I simulate the model. Instead, the model specifies the underlying parameters and variables that are needed to calculate resource intensity and NEPR.  One can calculate a steady state NEPR that requires one to simultaneously solve for steady state levels of population, the remaining size of the natural resource (since it determines the extraction rate), and the labor, capital, and capacity utilization for both sectors (goods and extraction sectors).

While increasing the engineering (resource) efficiency of capital is a technological characteristic, let’s consider changing a behavioral characteristic in the model: how we assume businesses pay wages.

In the results so far, wages increase with inflation. This is akin to many union contracts in the United States in the 1950s through mid-to-late 1970s.  But what if businesses do not have to increase worker wages with inflation?  At the simulation time, T = 60, about the time of the peak in per capita household resource consumption, I decrease the “bargaining power” of workers from 100% to 0% by time T=160, and this simulation is represented by the dashed lines (black dashed lines have no efficiency and loss of bargaining power; gray dashed lines have efficiency and loss of bargaining power).   The simulation results are now dramatically different.

  • Net output and the total resource extraction rate increase to a higher peak than before, but later decline to rates near or below when full bargaining power existed.
  • Total capital accumulation increases dramatically, by almost 10 times the levels of before.
  • Population declines to less than 80% of the levels with full bargaining power.
  • Per capita resource extraction (not consumption by households) increases to a higher level.
  • Wages decline to zero.
  • Participation rate (total employment as a fraction of population) increases to the maximum value of 80% instead of the previous steady state (“equilibrium”) value of 60%. (With wages so low, why not employ as many people as possible!)
  • NEPR declines to much lower levels.
  • The remaining amount of “available natural resource” increases (relative to full bargaining power).


In the context of relating net energy to some metric of economic well-being, NEPR declines dramatically while real wages per capita (and total) household goods consumption declines (eventually) to zero.  The reason why real wages and goods consumption decline to zero is that, as long as wages can still decline, businesses can continue to make a profit and invest in more capital.  Figure 2 show the capacity utilization of the capital (in the goods sector, but also similar in the extraction sector) also dramatically declines.  That is to say, business keep investing in capital that they can’t fully utilize because there is not enough resource extraction to act as fuel to operate the increasingly large number of machines.

Again, note that I have not previously specified what should be the NEPR (or dynamic EROI) over time for the resource (or energy) sector, and it is not intuitive to anticipate what would be the trajectory of NEPR over time even though it is (mathematically) possible to calculate an equilibrium “minimum NEPR” of this simulated world (i.e., assume no wages and solve for equilibrium power outputs and inputs).

Also, the model used for these results assumes that the more the natural resource is depleted, the more resource consumption is required to extract the marginal amount of resource (assuming all other things being equal).  So in this case of a loss of wage bargaining power, because the natural resource is larger, then we might expect the equilibrium NEPR to be higher because the resource is less depleted.  Therefore, it is the maintenance of a larger amount of capital, and thus the embodied resources (or energy) input into maintaining that larger quantity of capital that drives NEPR well below the levels with full bargaining power.

It is easy to imagine that this simulated world without wage bargaining power would not be a good one in which workers would live.  By the time of the end of the simulation, wages are practically zero, and there is no goods consumption by households.  In effect this is a slave economy.  The workers are still operating the machines in the economy because the model assumes a certain number of workers are required to operate the machines, and 80% of the population is working (at the assumed maximum employment rate).  It seems reasonable to say if you cannot bargain for wages at all, you could be driven to a wage of zero.  Thus, in this situation of a loss of bargaining power, the NEPR of the energy system ends up declining to very low levels because of how business investment in the resource sector is able to respond.  It is not that we specified the NEPR (or net energy) of the economy to decline, and then wages declined.

To drive home perhaps the most important point of this blog:

economic decisions about how to distribute monetary revenues have as much influence over NEPR, or EROI, results as the characteristics of the natural resource and extraction technology themselves.


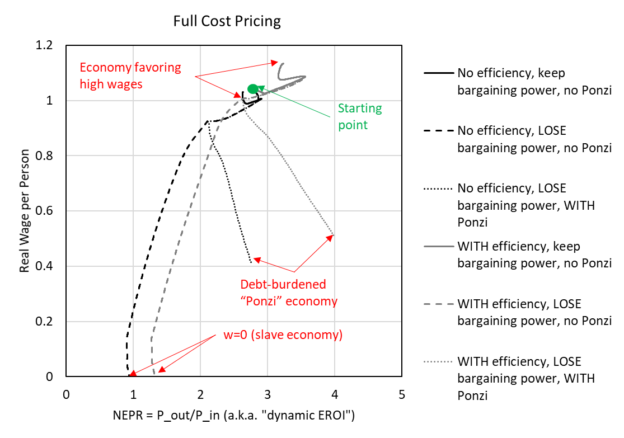
To imagine this idea further, I’ve made Figure 3 (which is perhaps more confusing) to plot real wages versus NEPR (the net external power ratio).  Each simulation starts at wages near 1.02 and NEPR near 2.8.

  • The simulation with full wage bargaining power and no efficiency stays near the starting value (going in a small clockwise pattern, black solid line)
  • The simulation with full wage bargaining power but with the increase in capital fuel efficiency increases up and to the right (higher wages and higher NEPR, gray solid line)
  • The simulations that lose bargaining power decline down and to the left until wages are at zero (e.g., a slave economy, dashed lines).
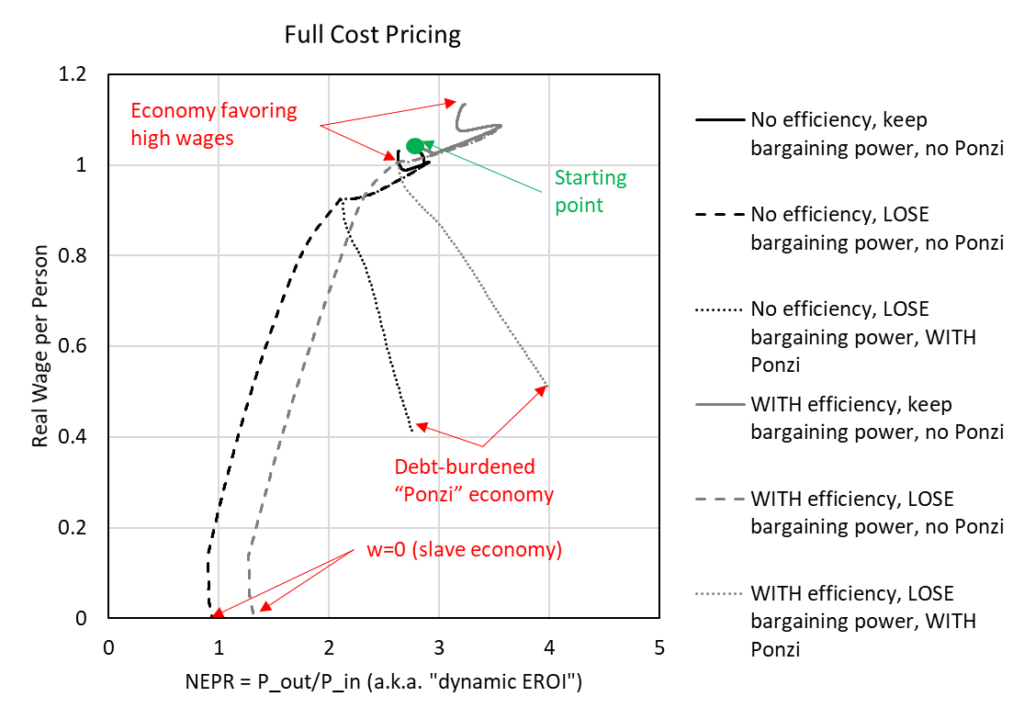
Figure 3. Plot of real wages versus net external power ratio (NEPR) using results from simulations used in King (2022) (“full cost” pricing).


The third category of simulation results in shown in the figures is the effect of what I called Ponzi investing.  The Ponzi investing also occurs simultaneously with the loss of worker bargaining power for wages.  While my definition of Ponzi investing in my paper likely doesn’t fit with the most true definition of a Ponzi scheme, it might have been better characterized as “speculative” investment.  Regardless, in my paper companies begin Ponzi investment when capacity utilization of capital decreases some amount below a “targeted” level (say 85% in the model).  That is to say, if the companies have $100 to invest, and capacity utilization is low (meaning there is “too much” capital since it is not being operated at the targeted level), then companies start to invest some of the $100 into pure debt rather than investing all of the $100 into new physical capital (or machines).

The effect of Ponzi investing (see in the figures) is to decrease the total accumulation of stocks (capital, population) and the resource extraction rate.  While real wages decline as in the case of no Ponzi investing, the wages don’t decline as much.  Perhaps unintuitively, the smaller population has higher per capita goods consumption, and while the model does not specify the distribution of consumption, we might interpret an “elite” banker population taking a high share of that consumption while the workers with lower wages consume a small share.

Finally, because the Ponzi investing diverts some profits, and thus natural resources, away from investing in physical capital (more machines), the NEPR of the energy system actually ends up increasing to levels higher than in the ‘baseline” case (with and without fuel efficiency) with full bargaining power and no Ponzi investing.  The catch here is that debt ratios rise considerably in Ponzi investing, as opposed to eventually declining to zero in this model, and this causes interest payments (from companies to the bank) to take a non-zero fraction of economic net output. These interest payments put downward pressure on company profits and wages, and again, we might assume flow to a class of bankers.

Results with Marginal Cost Pricing

Now I repeat the same results above but with one twist: how the model solves for prices. In the model there are four main costs: intermediate consumption (how much goods and resources must be purchased as operating costs), wages, depreciation, and interest payments on debt.  If all of these costs are passed into prices, then this is “full cost” pricing (as stated in the previous figure captions).  Many economic models do not assume full cost pricing, but instead they assume marginal cost pricing in which the costs of interest payments and/or depreciation are not passed (or included) in prices.

An example of a business model that includes full cost pricing is a fully-regulated and monopoly electric utility that owns the power plants and electric grid that serves its captive customers. In this case, a public utility commission approves (or disapproves) the utility’s investment and operating costs, as well as how much it can borrow (setting interest payments). All of these costs then dictate the price of electricity approved by the public utility commission.

Marginal cost pricing is perhaps more pervasive in the economy, and might be representative of companies selling commodities (e.g., energy, food) and various consumer and investment goods (e.g., furniture, cars) in which firms must compete to sell their items against many similar items from competitors. In this case, Firm A might want to pass on its costs of interest payments and depreciation to customers, but Firm B with lower interest payments might be able to sell at a lower price. Thus, Firm A will be pressured to sell closer to their marginal cost of production.

The Figures 4-5 below show the same plots as Figures 1-2 above, but instead by assuming marginal cost pricing.   I highlight some of the important differences, and in my paper I hint that the marginal cost pricing result shows more similar structural patterns of change to the U.S. economy. When assuming marginal cost pricing:

  • While wages are lower with the complete loss of wage bargaining power, wages are not force to zero as in the case of full cost pricing.
  • Capital accumulates to approximately 2X the level when assuming workers lose wage bargaining power, but this is much lower increase than the 10X increase when assuming full cost pricing.
  • The dynamic patterns are very similar (whether losing bargaining power or with Ponzi investment) for population, net output (GDP), the available natural resource, and resource extraction rate.
  • Per capita household goods consumption increases when workers lose bargaining power and slightly more when additionally assuming Ponzi (or speculative) investment by firms.
  • Debt (or the debt ratio) does not increase as much as with full cost pricing.
  • And finally, … NEPR (net external power ratio, or “dynamic EROI”) patterns are very similar in all marginal cost simulations, with the lowest level reached when assuming workers lose bargaining power (but there is no Ponzi investing). This lowest NEPR occurs in the equivalent scenario as when assuming full cost pricing as both have the highest capital accumulation and lowest capacity utilization.
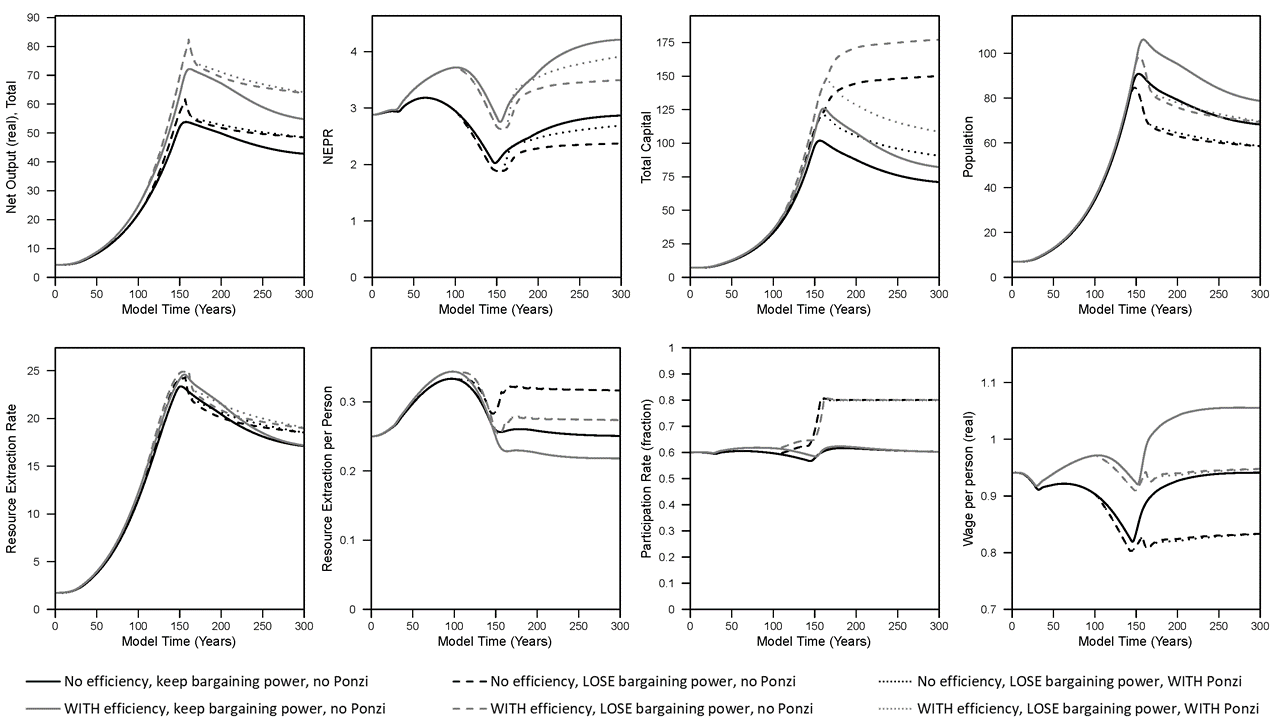
Figure 4. Results from simulations used in King (2022) (“marginal cost” pricing).
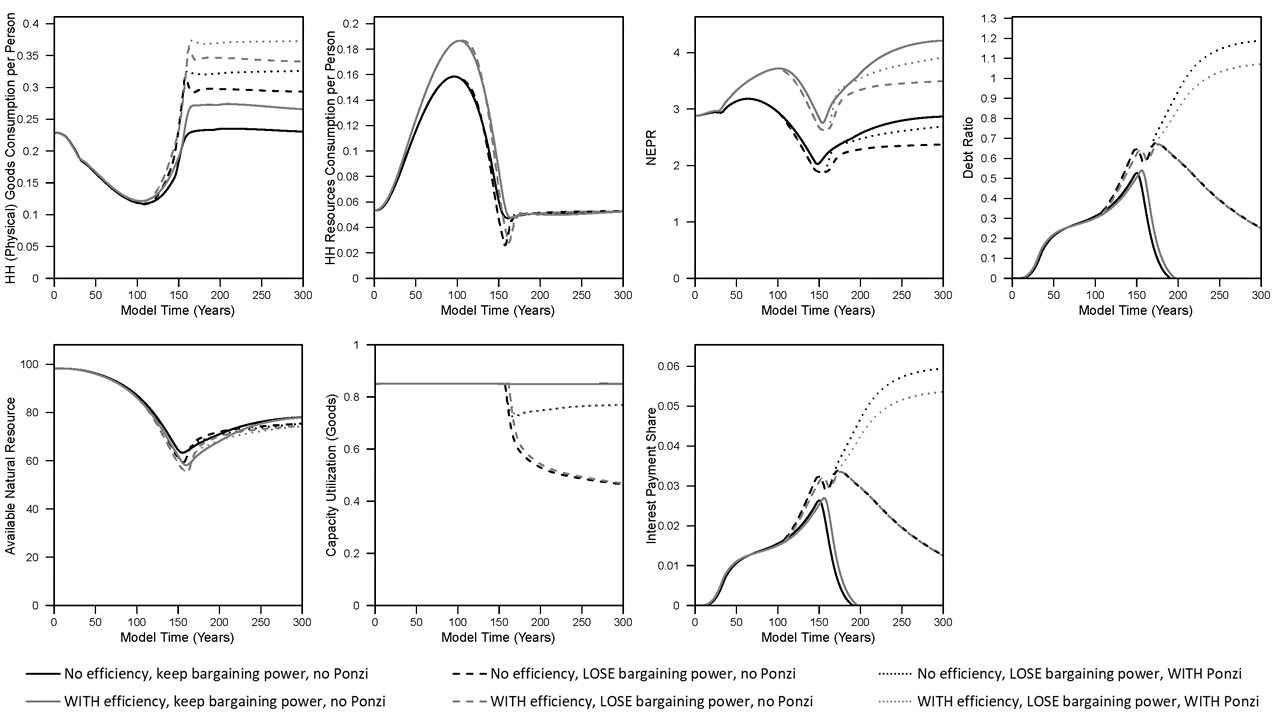
 

Figure 5. Results from simulations used in King (2022) (“marginal cost” pricing).


Summary

To summarize the main points of this discussion that considers how energy return on energy invested (or in my parlance, net external power ratio) relates to economic outcomes and the “structure of the economy”, consider:

  1. In my model and the real world, the NEPR (or “dynamic EROI”) calculation is an output calculated from the model and real world data. This metric is not an input assumption that can be fed into a model while remaining unaffected by the other variables within the model, and thus the same for understanding real world data and outcomes.
  2. There are at least two major economic assumptions about the structure of the economy that can greatly affect a calculation of NEPR (or “dynamic EROI”)
    1. how prices are formed: full costs versus marginal cost
    2. whether workers wages increase with inflation or not


There are many other highly important aspects of the economy that I did not explore within the paper I’ve summarized (e.g., different rules for how firms invest, there is no government sector, etc.), and thus the results at this point provide some insights rather than hard and fast rules.  To know more you’ll have to read the paper, read other blogs summarizing results, and watch videos of me explaining how the model works:

  1. ink to paper: https://link.springer.com/article/10.1007/s41247-021-00093-8
  2. See video: https://careyking.com/video-the-economic-growth-modeling-we-need-inet-oxford-university-may-2022/
  3. Another blog: https://careyking.com/new-harmoney-insights-into-the-interdependence-of-growth-structure-size-and-resource-consumption-of-the-economy/
Policy focus on ‘pain at the pump’ ignores history of how we got here

Energy policy focus on ‘pain at the pump’ ignores history of how we got here 

An op-ed posted October 31, 2022:

Recent surveys of Americans indicate “threats to democracy” as a top concern, only slightly ahead of usual economic choices of “cost of living” and “jobs and the economy.” These concerns are interrelated between energy and environmental constraints. Yet, most political discourse ignores these connections to the detriment of public understanding. This lack of understanding then leads to unnecessary political polarization as Americans become disillusioned with both private company and government decisions.

continue reading

Energy policy focus on ‘pain at the pump’ ignores history of how we got here

How Does Global Energy Consumption scale with GDP and Mass? A Biophysical Perspective

In my last macroeconomic modeling paper I compared my model outputs to the long-term pattern in global energy and GDP data (see my blog discussing the main takeaways).

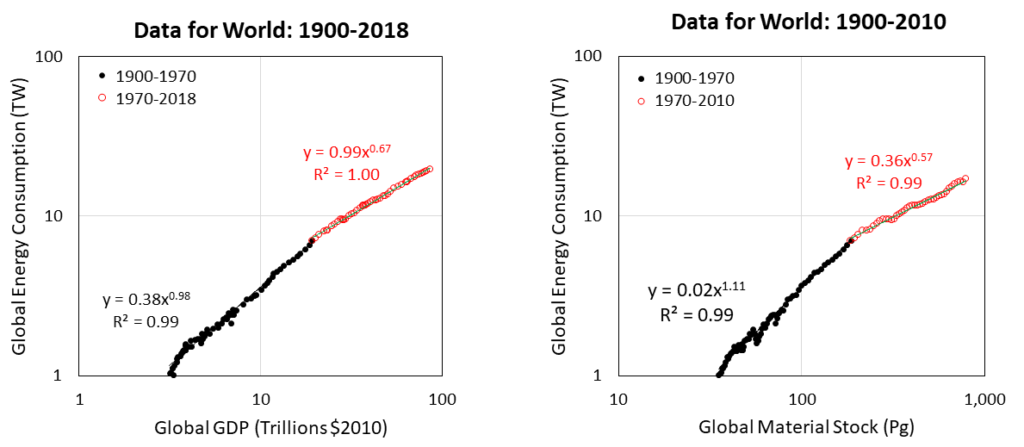
The energy data were arranged by colleague Andrew Jarvis as we discussed in this pre-print paper (a revised version again in peer review).  The data we discussed were those relating global primary energy consumption to real gross domestic product (GDP) of all countries (see Figure 1, left).

Figure 1. (Left) Global primary energy consumption vs. global gross domestic product (log-log axes). (Right) Global primary energy consumption vs. global material stock (log-log axes).


One very interesting feature of these data is that from 1900 to about 1970, there is one pattern in Figure 1, but after 1970s there is a different pattern.   That is to say, as indicated by the change in slope of the time series of data, the global economy seems to have operated in one manner leading to the 1970s, and in a different manner ever since.

There are two interesting questions relating to this feature, or change in trend in the 1970s.  First, what was fundamentally different about the years before the 1970s versus after the 1970s?  Second, are there existing ideas that can help us explain this change in pattern?

I discuss the second question first.

Many scientists have discussed a similar relationship in biology as we see in Figure 1. Single-celled organisms (eukaryotic cells, like amoebas) grow in a near linear manner relating energy consumption and their mass (or size).  If you have a 2 times bigger cell, that cell needs 2 times more energy consumption.  In a similar way, before 1970, when the global economy got 2 times bigger, it consumed 2 times more energy.  We call this “linear scaling”.

However, when scientists analyze multicellular organisms, including mammals, they tend to find “sublinear scaling.”  Thus, a rabbit that is about 10 times more massive than a rat does not consume 10 times more energy, it consumes about 5-6 times more energy since mammal basal metabolism scales with mass to the 3/4 power — (10 times more mass)3/4 = (5.6 times more metabolism). This trend for mammals is named Kleiber’s Law, and metabolism scales “sublinearly” with mass because the exponent 3/4 has a value less than 1.  The same type of sublinear scaling also occurs for “superorganisms” composed of many individuals, such as with ultrasocial insects like ants and termites.

Thus, in a similar was as seen in biology, the global economy transitioned from linear scaling to “sublinear” scaling in relating energy consumption and size.  Before 1970 global energy scales approximately linearly with GDP, or E ~ GDP1, when 2 times more GDP required 2 times more energy consumption.  But after 1970, energy consumption scales sublinearly with GDP, at approximately E ~ GDP2/3  such that when GDP increased 3-fold, energy consumption increased by only about 2 times.

So there seems to be a very nice parallel in growth patterns between biological organisms and the global economy.  In smaller organisms and a smaller global economy, energy consumption increased linearly with size, but in larger multi-celled organisms and a larger global economy energy consumption increased more slowly than size.

However, note one problem with the comparison so far.  The left image of Figure 1 uses GDP as the metric for size, but in reality it is not the best analog metric for animal mass because it has units of money per time.   GDP is a metric for a flow of output (this output measured as money per year). It is not a stock of accumulated mass representing the physical size of the economy in an exact parallel to biological organisms.

However, we do have estimates for the mass of the economy. Fridolin Krausmann and co-authors produced an estimate of the mass of accumulated materials in the global economy from 1900-2010.  These materials include such categories as wood, metals, plastics, concrete, bricks, sand, and gravel.  The right side of Figure 1 shows the pattern when we plot the same global energy consumption data versus the accumulated mass of the economy (in petagrams, or Pg, where 1 petagram = 1015 grams = 1 billion metric tonnes).

The right image of Figure 1 indicates the same basic pattern as the left image of Figure 1, but here the x-axis is MUCH MORE analogous to mass of biological organisms.  Here the scaling of energy to mass before 1970 is about 1.1, meaning that when accumulated economic mass increased 2 times, the energy consumption increased more than 2 times as much (say 21.1 = 2.1 times more).

After 1970, the scaling of energy consumption to mass is 0.57 (as opposed to about 0.67 when scaling energy consumption to GDP).  Thus, when the accumulated mass increased 2 times after 1970, energy consumption increased by only about 1.5 times.

You might ask about the mass of humans and livestock that are also part of “the economy”, but the total dry mass of ourselves and domestic animals is less than 1 Pg today, so our biological mass doesn’t change the data in Figure 1 in any significant way.

Now back to the first of our main questions about the change in trend in the data in 1970.  What was fundamentally different in the economy in the years before the 1970s versus after the 1970s?  Also, is there parallel explanation in biology?

My hypothesis, informed by biological literature, my macroeconomic modeling, and economic data suggest to me that both of the following effects started to dominate in the 1970s: (1) energy extraction became more expensive (in money and in terms of energy inputs), and (2) the world increased the distribution of materials among countries.

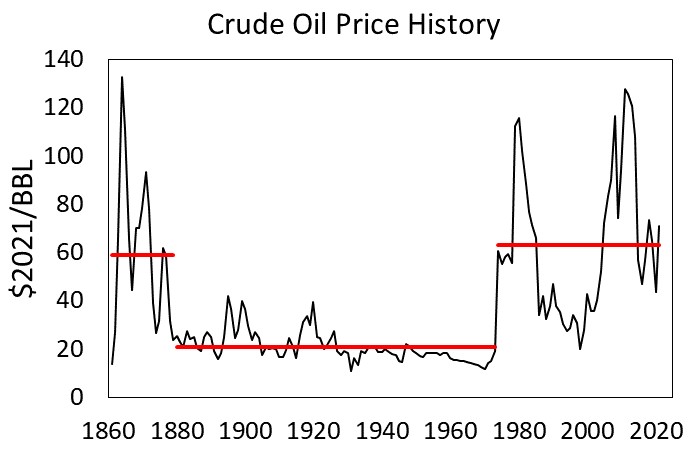
First, peak oil production in the U.S. in 1970 (yes, U.S. oil production in the last decade has since surpassed the peak in 1970), and the rest of the developed countries (e.g., Europe, Japan, Australia, New Zealand) forced a slowing of growth rates due to energy input constraints.  Oil has been more expensive since 1973, averaging about 63 $/BBL since that year, as compared to about 21 $/BBL for the previous 90 years.


Figure 2. Global oil price history in real dollars per barrel ($2021/BBL). [BP Statistical Review of World Energy]

My “HARMOMEY” macroeconomic model shows that an economy relatively unconstrained by natural resource (e.g., energy), such that it can growth increasingly fast, has near linear or superlinear scaling of resource consumption to size. However, once an economy becomes constrained in its ability to consume energy at higher rates, it has the tendency to move from a phase of linear (or superlinear) scaling of energy consumption to GDP to a new phase of sublinear scaling (see Insights 2 and 3 in my previous blog).  The earlier linear phase of growth occurs when the system (biological organism or economy) is not constrained by energy access, and it cannot perceive a boundary to its growth (the exponential growth phase).  It is instead constrained by the number of structures that are able to consume the energy.  Eventually, the system grows to sufficient size that it notices a limit to its resource access, the rate of energy extraction slows, and it begins to create new subsystems or levels of cooperation to access more costly (in time, space, and energy input requirements) resources.

This leads to the second possible reason for sublinear scaling after the 1970s: globalized trade.  Once the major world economies could no longer easily increase oil production at a whim within their own borders, there was an increased need to acquire and distribute resources (e.g., oil) and manufactured goods across the planet. World Bank data show that in 1970, the value (in money) of international trade was 25% of global GDP, but in 2008 it was 61%, and it has resided between 50% and 60% since.

This increase in costs and structures for both acquiring energy and distributing materials occurs when organisms become multicellular, and different sets of cells begin to take on specialized functions, or tasks (e.g., heart muscle cell versus a liver cell).  Larger biological organisms require more movement, or locomotion, to acquire food, and they develop networks to internally distribute nutrients within their bodies (i.e., blood circulatory system) just like the global economy had to develop new networks to internally distribute resources among countries.

As stated by DeLong et al (2010): “Metabolic rates of metazoans [small multicellular aquatic animals]  initially tend to increase linearly with number of cells and body mass, but as vascular systems evolved to distribute resources to increasingly large bodies, geometric constraints required sublinear scaling, converging to the 3/4 power scaling of Kleiber’s law …”.  We can viably argue that there were similar “geometric” constraints that became more prevalent upon the global economy starting in the 1970s.  While the Western industrialized countries still dominated global GDP in the 1970s and 1980s,  in order for the global economy to grow there was a greater imperative for more interconnection via an economic “vascular” system. We call this globalization.

In summary, the global economy and biology have very parallel growth patterns relating energy consumption to size.  It is critical more leaders and citizens understand the patterns described in this blog because most economic models are incapable of explaining these growth patterns.  This means both that most economists do not know why these most fundamental patterns exist and therefore their advice, derived from models and economic frameworks, cannot accurately inform public policy or corporate strategy.

This type of research and understanding also informs important questions related to the feedbacks, costs, and benefits from reducing greenhouse gas emissions at a given rate (the rate matters!) as well as whether we can decouple economic growth from material and energy consumption (it is unlikely).   I and others within the communities of biophysical economics (BPE Institute, ISEOF, Exergy Economics) and ecological economics (ISEE, USSEE, ESEE, etc.) are working on more accurate economic models that can inform this and other pressing questions (equity, debt, etc.).  Watch my latest talk (September 2022) at the Fields Institute in Toronto.


Why Central Banks Can’t Significantly Raise Interest Rates

March 19, 2022

Much current investment and policy discussion focuses on inflation and interest rates. The thought is that inflation has been running too high for too long since the onset of the COVID pandemic. Investors and policymakers want to know when, how fast, and to what degree the U.S. Federal Reserve (and other central banks) will raise it target interest rate to lower inflation. The main reason why the Fed won’t be able to raise interest rates to anywhere near historical rates is because of high debt levels. However, the main reason why we have high debt levels is not among the usual reasons given: energy.

In short, in the long-term, the sequence goes from energy to debt to interest rates.

Read the rest of the blog on Brave New Europe … 

Macroeconomic Modelling of Energy Efficiency: Implications For Reducing Greenhouse Gas Emissions

Macroeconomic Modelling of Energy Efficiency: Implications For Reducing Greenhouse Gas Emissions

January 31, 2022

This is something very basic we need to understand if we wish to stop climate change. Simple solutions are often simple because they are wrong. Energy efficiency will lead to a reduction of energy consumption is one of these.

Continue reading full post on Brave New Europe.


Summary of macroeconomic modeling paper: Insights into the Interdependence of Growth, Structure, Size and Resource Consumption of the Economy

Insights into my 2022 paper “Interdependence of Growth, Structure, Size and Resource Consumption of the Economy”

December 5, 2021

Carey W. King


This blog summarizes outcomes from my most recent publication:

King, Carey W. (2022) Interdependence of Growth, Structure, Size and Resource Consumption During an Economic Growth CycleBiophysical Economics and Sustainability, volume 7, Article number: 1. Free online access: website link and pdf.


Background

The purpose of this paper is to discuss the dynamic interdependencies among growth, size, and structure of an economy using outputs from an updated version of the Human and Resources with MONEY (HARMONEY) model that was published in 2020. This new version is HARMONEY v1.1.

Because of its structure, the HARMONEY model helps “narrow the differences” between economic and ecological viewpoints, which as the late Martin Weitzmann suggested, provides value by creating enhanced understanding of economic dynamics. That is to say, because the model simultaneously tracks physical and monetary stocks and flows, by including physical resources and constraints along with macroeconomic accounting and debt, HARMONEY speaks the language of both economists and physical and natural scientists.

I summarize the following insights from the paper:

  • Insight #1: Efficiency begets more consumption and accumulation, not less (Jevons Paradox)
  • Insight #2: Economy Shows Same Energy-Size Scaling as Biological Growth
  • Insight #3: Enhanced Interpretation of Decoupling Resource Consumption from GDP
  • Insight #4: Labor (wage share) vs. Capital (capital share) vs. Resource Consumption Tradeoff
  • Insight #5: Evolution of Economic Structure and Complexity


See below for “How the Model Works” and of course you can read the full paper for free.


Insight #1: Efficiency begets more consumption and accumulation, not less (Jevons Paradox)

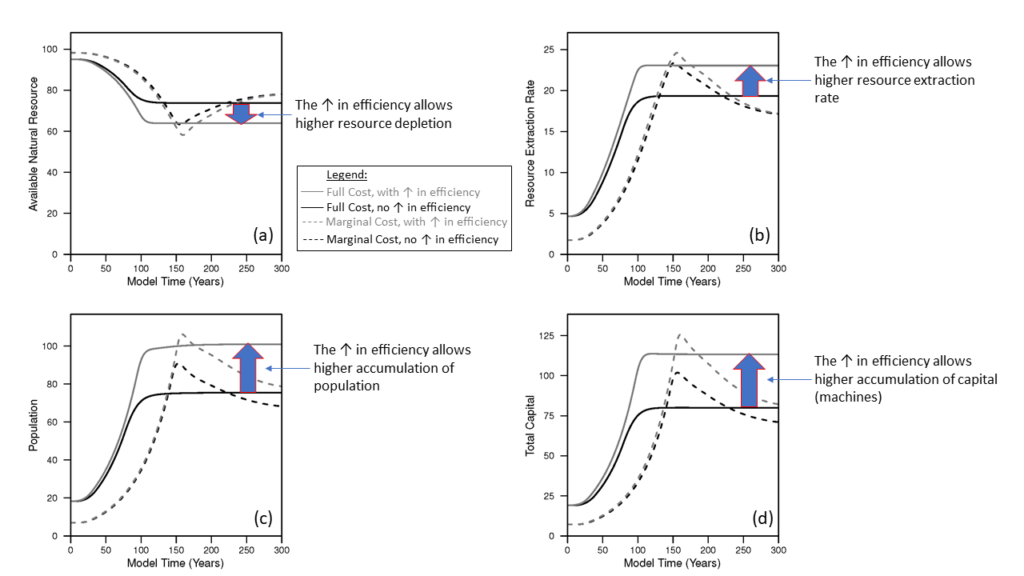
One of the frustrating aspects of reading most journal papers and discussions of economic modeling is the treatment of the concept of energy efficiency.  Given the HARMONEY v1.1 assumption that higher profits translate to increased investment, increasing energy efficiency clearly enables increased natural resource depletion (Fig. 1a), while enabling the economy to achieve higher resource extraction rates (Fig. 1b), population (Fig. 1c), capital accumulation (Fig. 1d), and net output (or GDP, not shown). In other words, the HARMONEY model supports the Jevons Paradox, or backfire effect, in that higher fuel efficiency in operating capital increases overall economic size and consumption. This theoretical finding is consistent with studies supporting the evidence for a strong rebound effect, as well as the general observation that over the course of industrialization to date, the human economy has indeed invented and employed more efficient processes while at the same time consumed more energy decade to decade.


Figure 1. HARMONEY shows how increased resource efficiency of capital (e.g., as fuel) enables more growth and resource depletion.


Insight #2: Economy Shows Same Energy-Size Scaling as Biological Growth

Figure 2 (Figure 4 in the paper) demonstrates an additional explanation of the relationship between natural resources consumption and growth by making an explicit comparison to biological growth. Figure 2a compares a typical metabolism versus mass trend (for a cow starting from birth per West et al. 2001) to corresponding results from the HARMONEY model.  Here I’m explicitly comparing two things.

First, an animal’s metabolism compares to the natural resources consumption in HARMONEY, and to total primary energy consumption in the real world data: animal metabolism compares to economy energy consumption.

Second, animal mass compares to physical capital (like cars and buildings) in the economy: animal mass compares to economic (physical) capital.  In the real economy there is a problem with adding up all the capital, but that is a much-discussed longer story, so I won’t go into that here.  Thus, most existing studies that make the economic-biological growth comparison plot primary energy versus gross domestic product (GDP), which is not as consistent of a comparison.  However, in HARMONEY, capital is a well-defined concept that can be summed consistently so I plot resource consumption versus both capital and GDP.

Figure 2a displays curves for an animal (e.g., a cow) total metabolic power and basal metabolic power, scaling with mass to the 0.5 and 0.75 power, respectively. The difference between “total” and “basal” is the metabolic power allocated to growth of new mass (shown at the bottom of the chart). One important point is that most organisms grow only to a certain size, with the trajectory of Fig. 2a moving up and to the right, eventually stopping at some point (indicated by the big red dot). The HARMONEY scenarios (assuming full cost pricing) show the same type of trajectory.

Figure 2. A comparison of patterns between (a) biological growth (metabolism and mass) and (b and c) economic growth (natural resources consumption and (b) capital and (c) GDP.


Figures 2b and 2c show the full cost pricing simulation for HARMONEY to compare to biological growth.  Just like in growth of an animal, the economy grows until a point at which it stops and remains at a steady state value of resource extraction, GDP, and capital.  Also, total and “basal” metabolism (for animals) and resource consumption (for the economy) come together at the end of growth (which is pretty much the definition of the end of growth).

Figure 2c shows the gray line from a simulation which assumes increases in resource efficiency of capital (like fuel efficiency, same as results in Figure 1). Again, you can see that the final values of GDP and resource consumption rates are higher if the economy can operate capital at higher efficiency.  We can also see that the resource extraction scales pretty similarly to both capital and GDP.  It is an open question as to how insightful it is to relate economic metabolism to GDP instead of capital; perhaps both are useful.


Insight #3: Enhanced Interpretation of Decoupling Resource Consumption from GDP

This paper has much to say on the issue of relative decoupling defined as increasing GDP faster than increasing resources consumption.   Decoupling can be envisioned by plotting data as in Figure 3 which shows the growth rate (e.g., the rate of increase) of energy and resources consumption versus the growth rate of GDP.  Global data use real gross world product (GWP) and global primary energy consumption.

Figure 3.  (a) Global data showing the growth rate of primary energy consumption versus growth rate of real gross world product.  (b) Comparable data from the HARMONEY model for growth rate of resources consumption versus growth rate of GDP.


Relative decoupling occurs when the growth rate data are below the 1:1 sloped line, in the shaded area (Figure 4).

Figure 4. Relative decoupling occurs when the growth rate data are below the 1:1 sloped line, in the shaded area.


Figure 5 shows that both the global data and the HARMONEY simulations show the same temporal trend which is to move in a clockwise direction in the figure.  First the both energy and resources consumption increases at nearly the same rate as GDP, and they both increase growth rates (which is to say grow faster over time).  This is to say the growth rates move up and to the right along the 1:1 line.  Second, once growth rates no longer increase, they move down and to the left into the relative decoupling zone.  For the global data since the mid-1970s, GWP has grown at about 3%/year and primary energy consumption at about 2%/year.

Figure 5. Both the (a) global data and (b) HARMONEY simulations show the same clockwise trend over time.


One important interpretation of this trend in growth rates goes against how most people think of the role of energy efficiency in relative decoupling.  A common interpretation of relative decoupling is that it occurs because the economy becomes more efficient in its consumption of energy in producing the goods and services of which GDP is composed.  However, when the HARMONEY model results reside in the decoupling zone, there is no change in any parameters of the model that can be associated with resource efficiency!  In fact, the opposite is the case: due to resource depletion, in the relative decoupling phase the dominant feedback is one of decreasing efficiency in that more resource consumption is required to extract a higher rate of resources.

The HARMONEY model moves from the 1:1 “full coupling” line to the relative decoupling zone because the GDP and resources consumption can no longer increase at increasingly high rates.  That is to say, not only does a stage of relative decoupling occur during periods with no perceivable increase in device energy efficiency, the shift to this stage of growth is evidence for limits to growth, not evidence against limits to growth. In HARMONEY v1.1, resource limits eventually constrain growth to go slower, and eventually go to zero, due to the definition of the forest-like natural resource in the model.

However, this is not to say that increasing resource efficiency is completely unassociated with higher levels of relative decoupling.  Figure 6 shows that increasing the resource consumption efficiency of machines, the economy can move more deeply into a state of relative decoupling.

Figure 6.  HARMONEY results highlighting that while relative decoupling is not definitively associated with increasing resource efficiency, an increase in resource operating efficiency of capital does move the results more deeply into relative decoupling.


Insight #4: Labor (wage share) vs. Capital (capital share) vs. Resource Consumption Tradeoff

Income inequality has been foremost in the minds of many people for the last 10-15 years.  The contemporary explanation is that there is a battle between “labor” (wages) and “capital’ (profits).  One way to measure this “battle” is to compare the share of GDP gong to wages (wage share) versus profits (capital or profit share).

The claim is that since the 1970s workers have lost “bargaining power”, or the legitimacy and support to ask for higher wages, largely because of the decline in support  (including from elected officials) for union membership.   I tested this idea in this paper, and the HARMONEY supports this general premise, but suggests there is more to the story: resource consumption rates.

I model workers having full bargaining power when their wages can increase with inflation.  Figure 7 shows that wage share declines during the growth phase as companies acquire some profit share.  However, once resource extraction rates level off (refer back to Figure 1), wage share rebounds back to its initial higher level and profit share declines to zero.

Figure 7. When resource consumption rates peak (and no longer increase), and when workers can bargain for wages, (a) wage share (the fraction of GDP going to wages) can stay high and rebound while (b) profit share of companies declines to zero.


Figure 8 shows that if we slowly remove bargaining power (by no longer allowing wages to increase with inflation) when resource extraction per person peaks (just as the trend begins in the U.S. economy), then wage share either declines (for the “full cost” scenario) as companies continue to invest in capital or wage share remains low (for the “marginal cost scenario).  See the full paper for descriptions of two different assumptions for production costs.

Figure 8. When resource consumption rates peak (and no longer increase), and when workers can bargain for wages, (a) wage share (the fraction of GDP going to wages) can stay high and rebound while (b) profit share of companies declines to zero.


These results show that nature of the distribution of economic proceeds changes once the economy stops growing. As one might guess, it is harder to make profits in a time a stagnant energy and resource consumption rates, and in the face of that slowdown or stagnation, profits can be maintained with the sacrifice of wages.  The HARMONEY model suggests this might be what happened to U.S. labor starting in the late 1970s and early 1980s.  Yes Ronald Reagan was elected President and he was a “union buster”, but we might also ask about the forces that propelled Reagan (and other business friendly legislators) to office and supported a reduction in labor-friendly policies.


Insight #5: Evolution of Economic Structure and Complexity

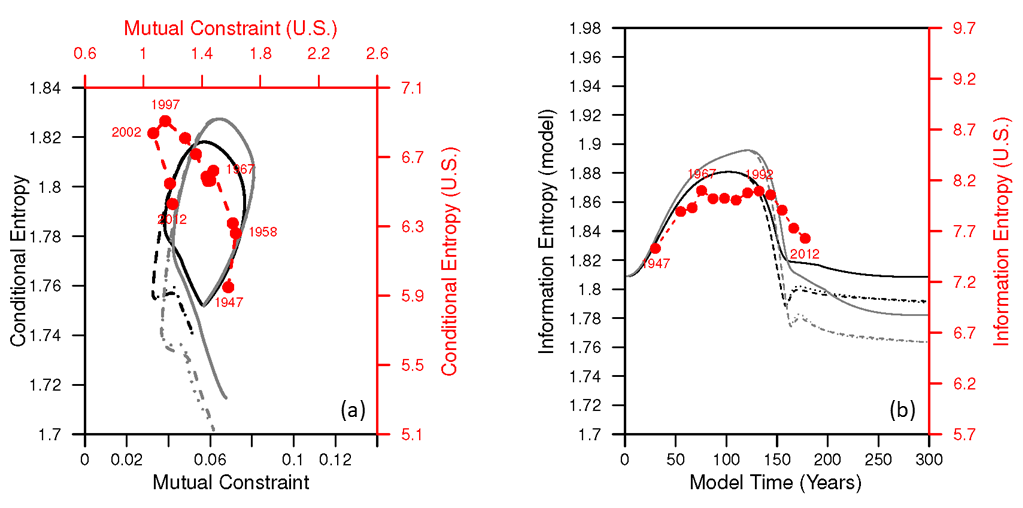
In a 2016 paper (pre-print and blog) I tracked the changing dynamic structure of the U.S. economy since 1947 using (information theoretic) metrics that quantify the distribution of the flow of money within the economy (specifically the input-output “Use” tables).  In Figure 9 I show two images that summarize some of the simulated HARMONEY scenarios as compared to the calculations from the U.S. data.

Figure 9a provides two metrics (mutual constraint & conditional entropy) that when added together form a third metric (information entropy) that is plotted in Figure 9b.

Why should we care about these metrics?  Many people view information entropy as a metric of complexity.  Higher information entropy means higher complexity, where complexity in the economic context means the economy is performing a more diverse set of activities with each activity associated with more equal contributions.


Figure 9. Information theoretic metrics that quantify the internal structure of the economy over time.  The data with large red circles and dashed lines show calculations from my previous 2016 paper. The lines without circles are simulated trajectories using HARMONEY v1.1.  NOTE: mutual constraint + conditional entropy = information entropy.


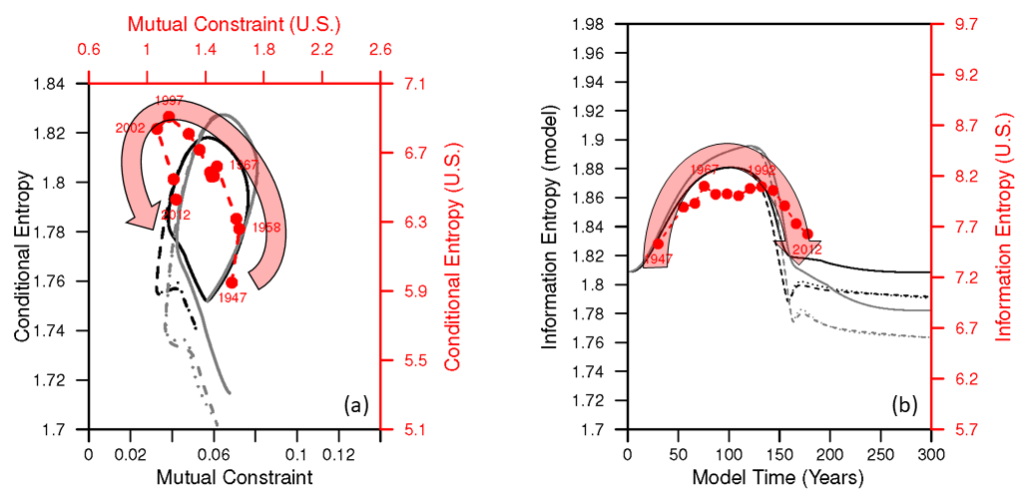
Figure 10(a-left) shows that both the U.S. data and the HARMONEY simulations show a counter-clockwise pattern during an expansion (fast-growth phase) that eventually leads to a slower-growth phase (after 1997 in U.S. data).

Figure 10(b-right) shows information entropy over time, and both the U.S. data and the HARMONEY model show three successive trends from increasing to constant to then decreasing information entropy.  Importantly (the paper describes more fully) the change in trends in Figures 9 and 10 relate to changes in both (i) the rate of resources (or energy) consumption and (ii) the cost of energy. That is to say there are similar reasons why there are changes in trends in Figures 9 and 10 for both the U.S. economy and the HARMONEY model.

Figure 10. Same as Figure 9 but with added red shaded arrow to emphasize the broad trend.


The comparison on Figures 9 and 10 provides evidence that HARMONEY accurately represents internal changes in structure and complexity of a real-world economy during a growth cycle.


Conclusion & Takeaways

The key takeaways are that both animals and the economy require energy consumption and resource to (1) operate their existing mass and capital, (2) make new mass and capital, and (3) distribute and acquire energy.  If you put these concepts into an economic model, as done in HARMONEY, you are a big step towards enabling your model to realistically describe energy-economic interactions.  This type of consistent modeling is important, for example, for the modeling of a low-carbon energy transition.  A low-carbon transition will very likely require major shifts in economic structure due to shifts (downward) in energy efficiency (think CO2 capture plants) and increase allocation of resources to make new capital (such several terawatts of wind, solar, and battery capacity across the globe).  I continue to work on HARMONEY to inform the structural dynamics of economic growth in ways that are not possible using the usual (e.g., neoclassical growth) methods.


How the Model Works

HARMONEY v1.1 is a system dynamics model centered on simulating a set of ordinary differential equations using stock-flow consistent tracking of monetary flows.  HARMONEY v1.1 is still a toy model, which is to say it is not yet calibrated (we’re working on it!) to a real economy, such as the United States.  Nonetheless, it has critical features and structural assumptions that make it applicable and valuable for comparing its trends to long-term trends in real-world data.

This is to say, an important part of HARMONEY is that it has a conservation of flow principle for both mass (as physical resources, energy or minerals, extracted from the environment) and money (at any given instant flows of money are tracked between firms, households, and private banks).  While this idea has been around for many decades, this is still relatively unique for macroeconomic models.

Here are several assumptions in the design of the model that help explain why it can mimic long-term real-world trends relating energy consumption and economic variables

  • The resource that supports the economy is a regenerative renewable resource stock, such as a forest.
  • Resource (mass, energy) consumption is required for three purposes in the model, just like the real world:
    • To operate machines (as fuel)
    • To become new machines when they are manufactured (embodied in new capital)
    • To “operate” or feed people to keep them alive (as food)
  • Money is effectively defined as all of the following
    • the compensation labor (workers) receive,
    • the profits received by companies,
    • money (as credit) is created when banks give loans to companies to invest in capital at levels beyond their profits, and the money is destroyed when companies pay back debt, and
    • the interest payments on the debt, or loans given to companies.
  • There is no government in the model.
  • Population declines when there is not enough resource consumption for households.

The Energy and Economic Narratives

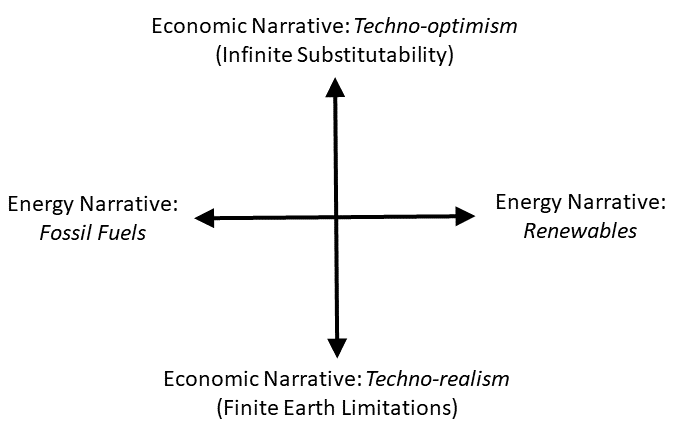
In my book The Economic Superorganism: Beyond the Competing Narratives on Energy, Growth, and Policy, I describe narratives along two axes (see Figure 1): energy and economics. Because people disagree as to the costs, capabilities, and benefits of different energy technologies and resources, proponents of different visions use narratives to convince stakeholders of the validity of their positions.

Figure 1. A diagram of narratives along two dimensions: energy—fossil versus renewable;
economics—technological optimism of infinitely substitutable technology versus technological
realism that the finite Earth imposes limits to growth.

The two energy narratives (fossil fuels vs. renewable energy) characterize the extreme views regarding the desired sources for our future energy system that best meet our future social and economic needs:

Energy Narrative: Fossil Fuels Are the Future

This narrative recognizes that fossil fuels enabled us to achieve what we have today. A proponent might say: “The physical fundamentals of fossil fuels, such as high energy-density and portability, ensure low cost and their continued dominance. Why not use them? Renewable energy technologies require subsidies to entice investment because they cannot achieve the historical or present levels of low cost and productivity of fossil fuels and related technologies. Therefore, we should promote increased fossil fuel use for the foreseeable future. Fossil fuels, and the technologies we have developed to burn them, enable us to shape and control the environment rather than the reverse situation before we invented fossil-fueled machines. Further, fossil fuels are the best hope to bring poor countries out of poverty while continuing
to increase prosperity within developed countries.”


Energy Narrative: Renewable Energy Is the Future

This narrative states we can use renewable energy technologies and resources to sufficiently substitute for the services currently provided by fossil fuels. A proponent might say: “Thank you fossil fuels, but we’ve modernized. We don’t need or want you anymore. Fossil fuel production and consumption create environmental harm both locally over the short-term (e.g., air and water contamination) and globally over the long-term (e.g., climate change) to such
a degree that their continued unmitigated use ensures environmental ruin that will lead to economic ruin. In addition, the concentration of fossil fuel resources means that countries and citizens have unequal ownership of them, creating geopolitical instability over extraction and distribution. Thankfully, renewable energy technologies are now cheap enough to transition from fossil fuels. Further, a renewable energy system is the best hope to bring poor countries out of poverty while continuing to increase prosperity within developed countries.”


Both energy narratives use economic narratives to justify their arguments, and these arguments shape energy policies that affect each one of us. Economic theory in turn informs us how to perform calculations that provide insight into the ramifications of choosing one energy pathway versus another.  My book discusses how one’s economic viewpoint, or narrative, can lead one to ignore important similarities and differences between fossil and renewable energy systems.  Here, I only state the economic narratives for consideration.


Economic Narrative: Technological Optimism

(There Is Infinite Substitution
of Technology to Achieve Growth and Social Outcomes)

This narrative posits unbounded technological change that creates substitutes for whatever we desire. It does not necessarily deny that the Earth is finite, but it does not believe that this fact affects economic or physical outcomes that impact the overall human condition. It is the view of most mainstream economists. A proponent might say: “Technological innovation has and will always address the pressing needs for society. In order to promote seeking of solutions, we need a signal. That signal is the price of a good, or a ‘bad’ (e.g., air pollution), and the signal is provided by setting up a market. Therefore we must establish and promote free markets, private ownership and profits via capitalism, and business competition. This is the way toward continued growth and prosperity. With regard to energy, as long the aforementioned criteria govern the economy, its price always decreases, so there is no need to worry.  Markets best address socio-economic issues because they process information better than any human regulator or government agency.” Got a problem? Make a market for it.


Economic Narrative: Technological Realism

(The Finite Earth and Laws of
Physics Impose Biophysical Constraints on Growth that Affect Social Outcomes)

This narrative takes to heart that the Earth is finite. It is the position of many ecologists, physical scientists, and some economists. A proponent might say: “Humans need food to survive and our economy requires energy consumption and physical resources to function. These facts very much matter for economic reasons because the feedbacks from physical growth on a finite planet will eventually force changes in structural relations within our economy and society more broadly. These changes can have positive or negative outcomes for our perception of the human condition, but to create positive outcomes, we must perceive, accept, and adjust to the physical limits of a finite Earth and relate our economy to physical laws and processes. Markets can work, but they have problems. Theoretically they can include all important pieces of information, but practically, finite time and incomplete information prevents formation of pure price signals.” The narrative is summed up well by a statement attributed to economist Kenneth Boulding: “Anyone who believes that exponential growth can go on forever in a finite world is either a madman or an economist.”


Consider these 4 narratives along the 2 axes of Figure 1 anytime you read and article, policy, or book promoting or disparaging a particular energy policy or technology.

How economic theories influence energy policy – Feb. 27, 2021 Opinion Editorial (Austin American Statesman)

February 27, 2021 (OPINION): “How economic theories influence energy policy“, Austin American Statesman

“Simply put, more of us need to think about the broader relationship between energy and economic theory” Read more …

ERCOT Blackout Feb. 2021: Takeaways and Notes from Texas House Joint Committee Hearings February 25, 2021

Texas House of Representatives Joint Hearing

Joint Hearing: State Affairs and Energy Resources

February 25, 2021

Summary and notes by Carey W King (https://careyking.com/)   

Contents

Committee members. 1

State Affairs Committee: 1

Energy Resources committee. 2

Power Generation: 3

Curtis Morgan (CEO, Vistra). 3

Mauricio Gutierrez (President & CEO of NRG). 4

Representative Smithee: 5

Representative Hunter: 5

Representative Darby. 5

Representative Anchia. 5

Rep Raymond (?). 6

Representative Howard (on electricity and NG markets): 7

Power Generation: THAD HILL, CEO of Calpine. 7

Session with Solar and Wind Industry Organizations. 7

Allen Nye (CEO of Oncor). 9

Kenneth Mercado (Executive Vice President, CenterPoint) 10

Bill Magness (CEO of ERCOT). 11

DeAnn Walker, Chairwoman of PUC. 11


Takeaways from February 25, 2021 House Committee meeting

  1. What: Some people giving testimony and some House Committee Members openly questioned if the ERCOT wholesale market structure can indeed deliver the level of electricity reliability that they desire.
    1. Why important? No one defines “reliability” the same. CEO of NRG suggested that Texas Legislators have the opportunity to define “resilience” and “reliability” for ERCOT and the electricity system.  House members (rightly) see the 4-5 day partial blackouts as a failure, as well as any rolling blackouts, but some had difficulty grasping that ERCOT actually also succeeded in performing its most critical job which is to operate and train its staff to keep the grid operating, at some level, under any unforeseen circumstances, and that is indeed what happened during the February 14-17, 2021 winter storm – the grid did not go completely dark.
    2. Curtis Morgan of Vistra stated: “I was a big proponent of this [ERCOT energy only] market, and my faith has been shaken.”
  2. What: Natural gas supply was insufficient to power all natural gas capacity that was functional (or available to operate).
    1. Why? One major reason was not enough natural gas facilities (some combination of owners of wellheads, processing facilities, pump stations, etc.) registered with transmission and distribution (T&D) companies as “critical loads”.  There is a process set up for them to register in this way.  Thus, when T&D utilities were asked by ERCOT to shed load (cut off power), they unknowingly cut off facilities that supplied natural gas to power plants.  Nye of Oncor (serving the Permian Basin area) stated that they had 35 NG facilities on their critical infrastructure list coming into the week of Feb. 14, and during the week it increased to 168.
  3. What: There is no organization (PUC or ERCOT) that considered themselves to have the authority to mandate weatherization of power plants.
    1. Why important? Weatherization would have helped, but it was not 100% of the problem. Testimony from power generators stated their availability of NG power plants was 90% for Vistra, 80% for NRG, and 10 of 12 plants for Calpine.  Both thermal power plant generators and the representative of the industry association that represents wind farms (and solar, batteries, natural gas) said there are tradeoffs in preparing for hot summers versus cold winters.  Ice on wind turbine blades is a major issue, and several options (from control systems to different features on turbines) are being explored.
  4. What: One thing that all committee members and those giving testimony could agree on: they need better communication.
    1. Why? The main communication point that the public did not receive is that they were in a severe emergency situation (such as in a hurricane) in which rolling blackouts were not going to occur, they should seek shelter, and they should prepare for days without power.  People with this warning (beforehand) or clear statement (during the blackout) could have made more informed choices for their safety and well-being.
  5. What: Texas House committee members were frustrated that if they have previously made legislation mandating that state offices (e.g., PUC) or other groups (e.g., ERCOT) file annual reports, that all of these annual reports are not diligently reviewed every year.
    1. Why important? I never heard a discussion of whether agencies fully staffed and funded to review every mandated document under their domain.


House Committee members

State Affairs Committee:


Member
Chair: Rep. Chris Paddie
Vice Chair: Rep. Ana Hernandez
Members: Rep. Joe Deshotel
Rep. Sam Harless
Rep. Donna Howard
Rep. Todd Hunter
Rep. Phil King
Rep. Eddie Lucio III
Rep. Will Metcalf
Rep. Richard Peña Raymond
Rep. Matt Shaheen
Rep. Shelby Slawson
Rep. John T. Smithee


Energy Resources committee

Position Member
Chair: Rep. Craig Goldman
Vice Chair: Rep. Abel Herrero
Members: Rep. Rafael Anchia
Rep. Tom Craddick
Rep. Drew Darby
Rep. Jake Ellzey
Rep. Charlie Geren
Rep. Tracy O. King
Rep. Ben Leman
Rep. Oscar Longoria
Rep. Ron Reynolds


Power Generation:

Curtis Morgan (CEO, Vistra)

Mr. Morgan stated:  “I was a big proponent of this [ERCOT energy only] market, and my faith has been shaken.” We’re risking this economic engine of this country [implied as Texas].


Main problems affecting the blackout:

  • Not fully understanding the natural gas system integration with the electric system (how the natural gas distribution delivers gas to power plants)
  • Weatherization: It is not clear that we should build enclosures around power plants because in the summer in Texas, it gets very hot and can detract from summer performance.
  • We could have had more public communication on telling people to be prepared for a winter event
  • We did not have an updated list or prioritization of critical infrastructure, such as to determine which infrastructures lose gas or power first in an emergency. We were turning off compressors and natural gas facilities, and that is not desirable when gas supply is critical.

We produced 35% of total ERCOT generation during February 15-17, and we generally have 18% market share.

Coal Power: They mine coal for Oak Grove and they had issues of their local coal delivery (via local rail). Also, they don’t normally cover their coal piles that got wet or froze up. So the coal became gummy and blocked the process of pulverizing coal to input into boilers.

Natural Gas: Their natural gas fleet was 90% available at NG plants, but they could not get the gas at the pressures that were needed to operate.

Nuclear: They came within 3 minutes of having the Comanche Peak (nuclear power plant) automatically trip off due to low grid frequency.


Fossil fuels vs. renewables: Mr. Morgan brought up how zero marginal costs of renewables stresses the market structure.  We’re going to need to investigate a change in market structure. This is a policy level change in decision to figure out how to deal with this “We are at a crossroads”. We need to continue to figure out how to evolve the competitive markets.  “There is a policy angle here”.  “There is a big debate in this country on the future of fossil fuels”.  We need to have revenues for companies to invest in capacity.

The lack of an enforced weatherization standard is not the entire problem that occurred on Feb. 14 and 15, 2021.


When asked why his company does not have reserve gas on site, or if more NG on site would have prevented the ERCOT blackouts the week of Feb. 14 (e.g., with 3 or 5 days of storage)?   Mr. Morgan:  The system has been so reliable (99.99%) that it doesn’t make economic sense to store more NG.  We do have some offsite storage and deliver it through price. More storage would have helped, but hard to say how much. Some of us have dual fuel capability, and we did lean on that a bit (and was limited by diesel trucks coming in).


Mauricio Gutierrez (President & CEO of NRG)

None of their customers will be exposed to high energy bills.

They have 8 GW of generation capacity and it performed at 80% of its capacity.  They produced almost 2X the amount of electricity as they produced in normal winter times at the beginning of the month.

There were 3 main reasons for lower generation from NRG fleet:

  1. Weather-related equipment failure
  2. Frequency
  3. Gas system deliveries


There are many factors that impacted their power plant performance, and they are:

  • South Texas Project (nuclear) Unit 1 went offline due to a freezing issues of an air service/sensor line
  • WA Parish units 5 and 7 (coal units): experienced a frequency trip, and both were online 24 hours later.
  • Greens Bayou went offline 2 times due to low NG delivery issues, but came online within hours

Gutierrez said there is now the chance for the Legislature to define “reliability” and “resilience” for the electric grid. The state agencies can find the best way to achieve these goals.  “Give industry the guideposts”.  There is no standard for weatherization. There is the opportunity to have that conversation.

When asked why his company does not have reserve gas on site, or if more NG on site would have prevented the ERCOT blackouts the week of Feb. 14 (e.g., with 3 or 5 days of storage)?   Gutierrez:  We need to think about the quantity of gas needed to store many days of NG on site. You’d have to store NG as LNG because the quantity is so large.  This is cost prohibitive.

It is important that we look at extreme weather in a different light, given what we have seen.   I believe climate change is real, and as a company we [NRG] are targeting to reduce carbon emissions 50% by 2035 and net zero by 2050 in accordance with United Nations targets to 1.5 degree C rise.


Representative Smithee:

He stated it seems ambiguous as to whether ERCOT is a governmental organization, and this is in decision at Texas Supreme Court.  He wondered if there is any reason we can’t make ERCOT a government agency under PUC or other agency?


Representative Hunter:

To each person testified, Representative Hunter asked pointed questions about who (persons or entities) were at fault.  He asked questions such as: Who’s at fault? I don’t want to hear about “systems”?  I want people to know who screwed up? I want details.

Answers to these questions were generally that many parties are responsible: 1) natural gas suppliers, 2) power generators, 3) Texas Public Utility Commission, 4) ERCOT, and 4) transmission and distribution utilities

Representative Hunter emphasized the need for better communication by all parties (power generators, utilities, ERCOT, Public Utility Commission, Governor’s office).


Representative Darby

This “feast or famine” 9000 $/MWh creates volatility that doesn’t really incentivize financing.

He emphasized the need to revisit how to incentivize investment in ERCOT outside of the 9000 $/MWh offer cap of the Operating Reserve Demand Curve.


Representative Anchia

Rep. Anchia expressed that the current ERCOT market design seems to have the perverse outcome that we can’t incentivize new baseload power to be installed unless we have extreme weather that juices up costs.

Rep. Anchia: Does the market still have perverse outcomes and increases volatility that we need to address?

  • Morgan: yes
  • Gutierrez: yes


Mr. Morgan responded to Rep. Anchia that much of their equipment (they buy?) is designed to operate at 10 deg. (F?), and they weatherized $10 million was supplemented to try to get us closer to 0 degree capability, and these were more short term changes


Mr. Morgan responded to Rep. Anchia stating that the ERCOT market has have increased volatility relative to years ago due to the 9000 $/MWh offer cap and steepness of the Operating Reserve Demand Curve.


Rep. Anchia stated we need to create a market that avoids too much volatility and scares investors.  A recent Wall Street Journal survey suggests that the ERCOT wholesale matket design has caused Texas customers to pay 10s of billions (?) more than other areas.

  • Gutierrez: I disagree with WSJ survey article.  EIA shows Texas has lower 1/3 prices.  The wholesale rate has kept coming down.  I think competition has helped Texas.
  • Morgan: I agree with Gutierrez.


Rep Raymond (?)

Asked for ideas in 1 week: Last session I introduced HB 34 on emergency communication system. It didn’t get a hearing to pass. Hopefully now it will.  He asked those giving testimony to tell the legislature what can be done to make this better, and report back in 1 week.


On subsidies: During testimony of Mr. Clark and Mr. Hemmeline, Representative Raymond stated that we have to try to move away from politics as last week’s events are so tragic.  He realized that people sometimes don’t like discussing tax credits and subsidies etc.  But he said we should talk about all the tax credits that oil and gas gets (state and federal), let’s put it all on the table.


Representative Howard (on electricity and NG markets):

I’m interested in the market issues.  We sort of know how things work but not all of the details.  What about a lower price cap with a capacity market? Do you know what you would really want?  What structure meets the needs of reliability, affordability, and lower risk (even it not financial risk, but risk to livelihoods)?  How do we restructure?  Since NG prices are not capped, this sounds like it doesn’t work.

Morgan:  We could consider a capacity market. This does keep some old capacity on the system that only runs 1 week or so per year. But that might be nice in the situation such as last week. There are things we can do on the “all energy” market. We can increase the amount of reserves that are required and then drop the price cap. Let’s remember, ORDC is a construct, but the pure marginal cost system wasn’t working either.  We could add a specific product for fuel security.  We can’t ignore the idea of re-regulation, but there is a reason we left that idea and I think it has served us well, so I’m not suggesting we go back.  I like idea of some reduction in price cap with an increase in reserves, but I’m not advocating yet.


Power Generation: THAD HILL, CEO of Calpine

Hill: We had about 2000 MW going offline at about the same time.

  • Freestone power plant: We think a relay leading to “balance of plant’ (runs pump), and we think this was triggered off by frequency imbalance
  • Deer Park: One of the relays opened. This is usually due to voltage and frequency caused. We think it was a frequency issue.
  • Plant in Corpus Christi: This plant went off due to losing gas supply (at the “gas yard”) which lost electricity. The gas crew flew in a generator to get the gas yard back operating.

We started losing gas supply broadly by late morning or early afternoon Feb. 15th. These were back on Wednesday (Feb. 16th). We had some firm capacity and producers cut us off since they couldn’t get the gas into pipelines.  40% of their deliveries were cut from suppliers on Wed. Feb. 16.  There were times when 40% were offline due to loss of gas supply.

Freezing at out power plants:  We started in 2011 on best practices with ERCOT and TRE, and we do this every year.  We still lost 2 of 12 plants due to freezing conditions.


Session with Solar and Wind Industry Organizations

Charles Hemmeline (Executive Director, Texas Solar Power Association)

Hemmeline:   Solar output generated more than ERCOT planned (starting Feb. 15?) given expected generation.  Several solar sites were set offline, many (200+) inverters had to be manually reset, and one solar photovoltaic plant was shut down due to icing on transmission lines.


Jeffrey Clark (President, The Advanced Power Alliance)

Jeffrey Clark:    We represent, wind, solar, batteries, investors, and even NG customers.  This issue has shaken my confidence in a reliable system, and we have to fix this going forward.    We also had a failure of transmission.  Freezing fog is what affected some wind turbines.  We’re looking at ways to shed ice from wind blades, limit ice accumulation, and other methods to keep wind turbine blades from icing.


Jeffrey Clark (on renewable industry obligations in ERCOT market):   It is important that most renewables are funded via Power Purchase Agreements.  There is a perception that wind and solar can just show up and produce whenever they want to, and don’t feel repercussions.  These generators have been affected by the grid blackout.   When do we change any ERCOT rules? What are the mechanisms?  You can be assured that wind and solar members of my organization did not benefit from the high prices and events we experienced.


Jeffrey Clark (on wind turbine performance):   Mechanically, we’re aware of weather issues, but we are assessing if this is a “new normal” and how do we make the power available when needed.   Freezing fog in San Angelo/Sweetwater area had a particularly rough impact.  We’re looking into that.  Shaking ice off of blades is possible but tricky (e.g., if you shake off ice above the nacelle onto the nacelle). We’re talking with OEMs on the options for de-icing on wind turbine blades.

Cold weather by itself is not an issue in itself. There are heating elements to keep lubricants functioning properly.  The typical [wind turbine] machine can go to -15 deg. C (some to -30 deg C).  So it is not the cold itself that is the problem.

Question: Is snow generally a problem?  Clark: Every region had trouble with power generation, even in SPP and West Virginia.  It is the icing of the wind turbine blades that seems to be the major problem here.


Clark was asked: If we are going to have a discussion of how we get more capacity, are we going to have to consider how subsidies for wind and solar affect generation investment?   Clark:   I think we need to look to all subsidies.  Coal has been subsidized since before we were a country.


Allen Nye (CEO of Oncor)

Nye:   We did plan to do rolling outages, and we did this at first late Feb. 14 and early Feb. 15. At 2:02 am Feb 15 we experienced 59.302 Hz and this was a critical event. By 4:43 we know multiple gen was offline.  By 8:03 state was shedding 16 GW.   Why was 2:02 am important?  The importance of under frequency relays are required to have an automatic response to drop load faster than people can respond. They are the last measure to prevent total grid blackout.  They are set to trip at 59.3 Hz.  There were within 0.002 Hz of getting to this limit.   We did have some under frequency relays trip, we don’t know why some did or didn’t.    The situation was so fast we were worried about customers being in dark for say 1 month if ERCOT went completely dark.


What about inability to do rolling blackouts?    Nye: We’ve got to communicate better.   We should have contacted people to let them know that rolling blackouts of 15-30 minutes were not going to happen anymore.

We are required to have 25% of our load on feeders that have special devices called under frequency relays.  To get to 25% of load, this is 40% of their feeders that have these relays, and these circuits stay online 100% of the time to act in emergencies and these feeders STAY ON ALL THE TIME because we need that automatic control capability.  The distribution of these is to GEOGRAPHICALLY DIVERSE to buffer the system (he can show the maps of these) and they are generally heavier when you have more load.  There are more in urban areas since there is more load there. They are distributed based on where the load is NOT rich vs. poor areas. He gives a campfire analogy to say these relays are like

2nd bucket of critical circuits make up 8-9% of his feeders that serve hospitals, critical care facilities, airports, 911 call centers.  Now this leaves only 51% of feeders that are left as even possible to rotate or turn off.

My Nye knew that equity would be a question. He called COO Debbie Dennis and Chief Counsel to make sure they were not cutting off people in an inequitable manner.  We (Oncor) were as equitable as we could be.

Total premises out of power in Oncor regions:

  • Dallas NE: 47% (preston hollow, highland park
  • Dallas N: 53% plano, richardson,
  • Dallas SW (I30 corridor): 47%

Other metrics they used, # underfrequency relays, # loadshed feeders, % customers interrupted and all of these are pretty equal metrics. I see no institutional equity.


Speaker Craddick: Are O&G producing wells not on critical infrastructure with you, Oncor, but they are with Centerpoint?  Thus you shed load associated with O&G production, so do you know how that impacted the rest of the grid?

Nye:   On gas supply issue, after 2011, there was a push that critical gas facilities were on a critical list to provide gas.  There is a process to be designated as such, and to your point (Craddick), I don’t know how power plants get gas or who is delivering.  The NG producers have to tell me (Oncor) if they are delivering gas to generators, otherwise I don’t know.  We had an identified 35 specific facilities that were delivering gas and we never cut those off from electricity.  During the event, PUC Chairperson Walker would call with names of folks indicating desire to turn on the power so they could deliver gas, and we did this, and by the end of the event we added 168 more locations to the critical list and we never again turned them off.   We need better coordination of NG producers and generators with T&D.


Question from Representative Hunter: Here comes March, another storm is coming, what do you think you can do better?

Nye:   Communication for sure. We received more inbound telephone calls in 2 days than we did in all of 2020. Our phone system (with AT&T) crashed and our customers could not get through to us. Make sure we have adequate technology for people to contact us.  Make sure we are talking to legislature better.  Better communication with O&G suppliers to not cut them off.  Work on water districts and know much they can be rotated.   Biggest issue with water utilities is they don’t like to be surprised (so tell them the plan).  We had about 1.33 M out on their system at one time, but on Wed. when they were allowed to turn on more, all but ~140K were able to come online and this was mostly due to ice storm damage around Waco/Temple/Killeen area. SO this tells me Oncor was generally ready to come online when they could (T&D was generally working).  This last ~ 100K customers was actually pretty tough to turn back on.   We can use data analytics to more quickly know what parts of our system are broken.  We can encourage conservation (as mentioned by Mercado as Centerpoint has done).  For our industrial customers, who are mostly at transmission voltage, and they are at backbone of system and we didn’t want to turn on transmission level lines.  Over 50% of industrial customers voluntarily came down, so we can use that idea going forward.


Kenneth Mercado (Executive Vice President, CenterPoint)

Rep. Herndandez: [To Mercado]: We had a visit how you determine who to turn off. There are “buckets” of types of loads.

Mercado: We look at the circuits in thinking of load shed, we don’t look at neighborhoods.  The load shed is pre-programmed.  Heavier demand for load shed where there are larger loads.  We got 59 orders for load shed from ERCOT, and each order changed the buckets of load shed changed.  We don’t have the infrastructure in our telecommunications to do more coordinated load shed using smart meters?  We have to measure and trigger load shed in milliseconds. The only way we can actually measure load is via SCADA system.   We need to figure out a way to get the meter speed of communication to our feeders faster.


Question from Representative Hunter: Here comes March, another storm is coming, what do you think you can do better?

Mercado:    Not so much to add. Communications is key.  I realized how important it was to be an expert communicating with the public in real time. The problem with my message on Day 1 (with NPR, Houston stations, etc. that I then learned to correct) was I could not tell them “how long” the grid will be down.  I only know what was happening in our company, so I was limited in knowledge, and we need more information to make people comfortable.  We need a better software approach for better load shedding.  We planned for losing 2-3 units, but now we have a situation when 50% of generation can go out, and we need a better solution.  We need to be more transparent and dynamic in our load shed while still protecting critical loads and underfrequency relay feeders.


Mercado:  Due to turning circuits on and off many times, we had to replace 1000 pad-mounted transformers after this event (due to their cycling broke them)


Bill Magness (CEO of ERCOT)

Magness: Texas suffered. Our goals is to prevent this type of event again.  We are like air traffic control for the ERCOT grid (90% of customers, 75% of land mass).  We can only stay at 59.4 Hz for 9 minutes before generators automatically trip offline from low frequency relays.  Figuring out how to actually do rotating blackouts is critical.

Mr. Magness was repeatedly criticized for ERCOT not having a more effective and direct communication that the grid situation was so severe that rolling blackouts were not going to be able to be in place and that some regions of the grid were going to be in a long-term power outage while some regions were going to stay on.


[note from this note taker: Apologies for not as many notes on Bill Magness testimony]


DeAnn Walker, Chairwoman of PUC

Walker:  By statute ERCOT is accountable to the PUC.  PUC can apply penalties per PURA or ERCOT protocols. Can impost administrative penalties, and they max at $25K/day/violation.  Largest to date is $2M.   She noted that the FERC 2011 report had 26 recommendations but none to PUC [[Note: but PUC would have been involved in overseeing and agreeing to any new mandates]].   Quanta Energy Services ensured that 2011 legislation calling for a report on preparedness, that a report was filed, and it had 9 recommendations for PUC and PUC implemented all of them.

I don’t think PUC has explicit authority to require winterization of generation because we’ve not been given clear authority.   The 2011 TX bill did have this requirement but it was removed before passed.

Each year ERCOT is to file a report on weatherization plans, and it filed that report in January 2021 stating compliance of the power plants.

Regarding the PUC order on Feb. 15: They heard that how their models we rerunning, in load shed that you will go to 9000 $/MWh cap.  But ERCOT was getting reserves and bringing on customers, and so the reserve was sitting there and sending the signal that not all generation was needed. So we told them to move to 9000 $/MWh.  On Feb. 21 we had another emergency meeting, we urged all REPs to delay their invoicing to customers, and not disconnect them, and give the option for a long-term payment plan. This only applies to IOUs, not municipal utilities or co-ops.

Here are some things for PUC and community to work on:

  1. Better electric and gas coordination. After 2011 we worked on these issues, but over time we were not as diligent.
  2. Look at the overall market. This 9000 $/MWh cap was never meant to go for 9 days.
  3. Whether or not I have the authority, I was told in the Senate that I did have the authority, but I don’t think I do.  Need to make this clear.
  4. ERCOT board was a big issue. You need to consider if changes are needed in the makeup of the ERCOT board.

On Wed. Feb. 10, we knew a storm was coming in, but not 100% sure how bad.  I had a generator call me (Feb. 10 or 11) and said 3 of their units we going to be curtailed and needed help getting NG.  The RRC quickly passed an order to allow electric generation to have high priority getting gas.  In the moment, she was discussing coordination in the NG supply chain (well heads, processing plants) and worked with Oncor to get these facilities power turned on.  Typically their call center is not open on the holidays or weekends, so she did keep it open on the weekend.  We “worked” with the industrial customers telling them they need to have them come offline.  That Thursday and Friday she was asking generators and TDUs checking to see that PUC could do for them.  What did you know and what did you know … really I started actions on Wednesday (before the storm?)


Representative Lucio criticized the Chairwoman Walker and the Public Utility Commission as largely lacking any communication to the public on the severity of the electricity crises and what they can do to prepare even though he believes the PUC (not ERCOT) had the responsibility for this communication.


[note from this note taker: Apologies for not as many notes on DeAnn Walker testimony]